


The Distribution of Debt Burdens and Servicing Costs for Illinois Grain Farms Across Interest Rate Cycles
On Wednesday, the Federal Open Market Committee (FOMC) cut the federal funds target range by another 25 basis points to 3.50–3.75 percent, marking the third reduction this year and extending the rate easing (cutting) cycle that began in September 2024. This follows an aggressive tightening (hiking) cycle from March 2022 to July 2023, when the Fed raised the target range by more than 500 basis points, from 0–0.25 percent to 5.25–5.50 percent.
Over time, lower benchmark rates will translate into reduced borrowing costs on operating lines of credit, machinery and equipment loans, and farmland real estate debt, providing meaningful cash flow relief for many farm borrowers. While the balance sheets of most Illinois grain farms remain healthy, a small subset is showing signs of stress.
In this article, we use data from the Illinois Farm Business Farm Management (FBFM) Association to examine how grain farms have managed debt capital across different interest rate environments between 2019 and 2024, and to track how both debt burdens and debt service costs have shifted over time.
First, we calculate and report the quartile distribution of the debt-to-asset ratio to summarize changes in leverage. The debt-to-asset ratio measures farm solvency by showing the share of assets financed with debt rather than equity, so higher values indicate greater reliance on borrowed funds. Quartiles split farms into four equally sized groups based on their debt-to-asset ratios in a given year. The lower quartile (25th percentile) is the ratio below which 25 percent of farms fall—these farms have the strongest solvency and lowest leverage. The median (50th percentile) is the midpoint: half of farms have lower ratios (stronger solvency) and half have higher ratios (weaker solvency). The upper quartile (75th percentile) is the ratio below which 75 percent of farms fall; the remaining 25 percent—the most highly leveraged operations—have debt-to-asset ratios above this value.
Second, we use these annual debt-to-asset ratio quartiles as cutoffs to sort grain farms into four groups (0–25th, 25–50th, 50–75th, and 75–100th percentiles) and then calculate, for each group, the average interest expense as a share of gross farm returns and the average share of total debt coming due within twelve months. This allows us to compare how borrowing costs and near-term repayment obligations differ across the leverage distribution and how those patterns evolved through the recent tightening and easing cycles.
Figure 1 shows the annual quartile distribution of debt-to-asset ratios for our sample of grain farms. From August 2019 to March 2020, the federal funds target rate was lowered by 225 basis points, from 2.25-2.50% to 0-0.25%, and remained at near zero until the spring of 2022. During this period of low interest rates, debt-to-asset ratios declined across all quartiles. Although grain farms, on average, increased their total debt within each quartile group, the value of their total assets increased by an even greater amount, driving the ratio lower. For example, among the most leveraged grain farms (those above the 75th percentile), average debt rose from $1,478,470 to $1,808,397, an increase of 22.32%, while average total assets rose by 40.14% from $2,967,996 to $4,159,374. However, this trend reversed from 2022 through 2024, as debt growth outpaced asset growth, causing the debt-to-asset ratios to rise at every quartile level.
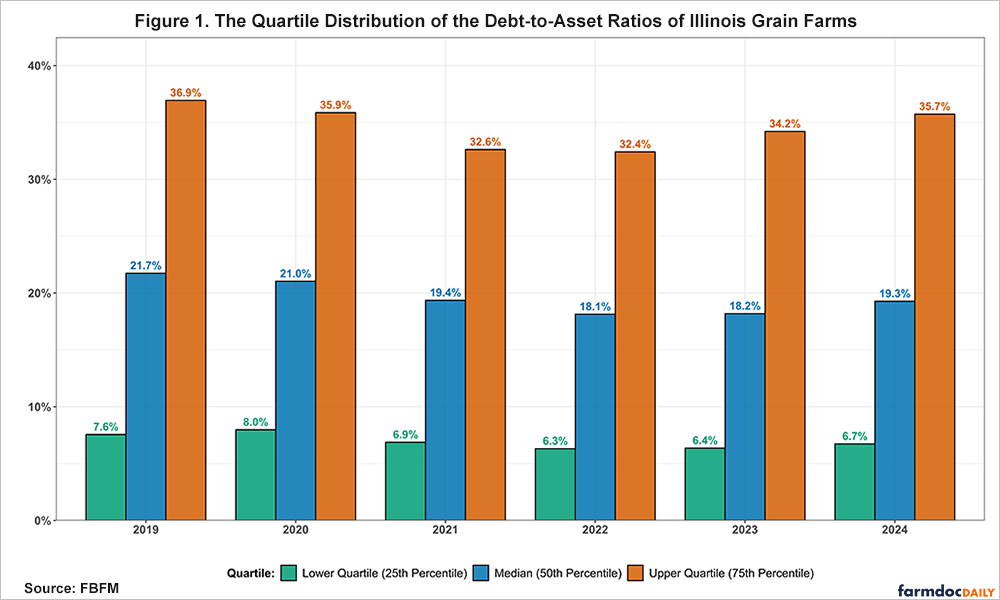
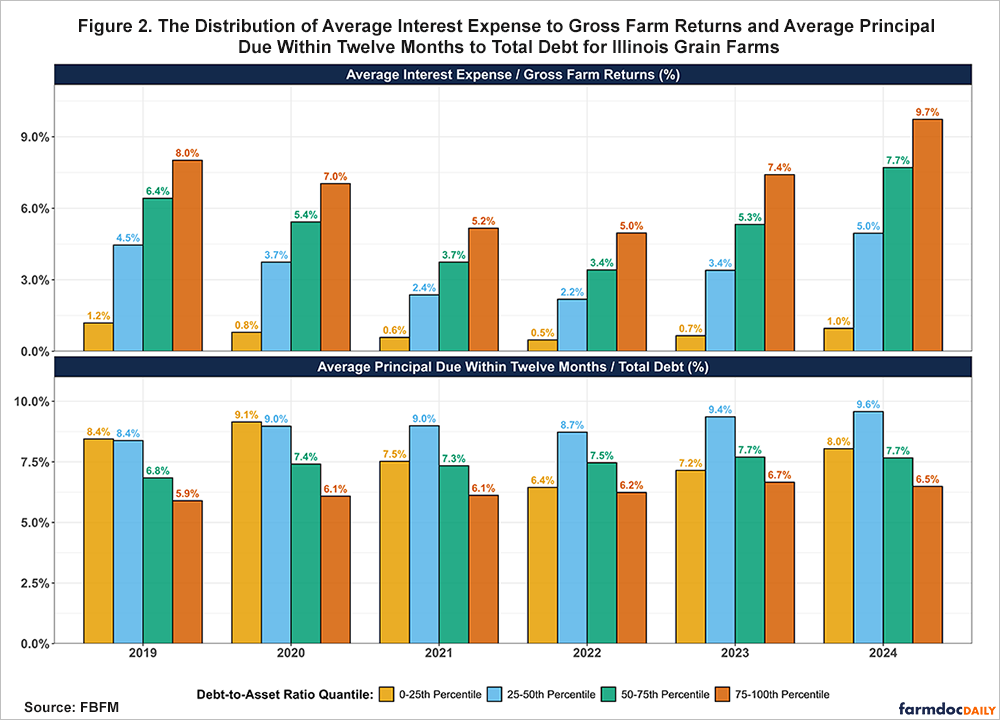
Figure 2 shows the distribution of two related measures by their debt-to-asset quartile group. The top panel reports the average ratio of interest expense to gross farm returns, while the bottom panel reports the average share of total debt coming due within the next twelve months. The interest expense to gross farm returns ratio (or interest expense ratio) is a measure of financial efficiency and conveys the burden of servicing debt relative to the farm’s gross income; a higher ratio indicates a greater debt service burden and lower financial efficiency. According to the Center for Farm Financial Management’s Farm Financial Scorecard, an interest expense ratio of 5% or less is considered as strong, while a ratio between 5-10% is cautionary, and a ratio greater than 10% is vulnerable.
The top panel of Figure 1 shows that half of grain farms (those in the 0-25th and 25-50th percentile) maintained strong interest expense ratios throughout the 2019-2024 period, with average values of 5% or less, even as interest rates rose. However, grain farms belonging to the 50-75th percentile and 75-100th percentile debt-to-asset ratio groups saw their respective average interest expense ratios rise from 3.4% (strong) and 5.0% (strong) in 2022, to 7.7% (cautionary) and 9.7% (cautionary) by 2024. For the latter group, this implies that a meaningful share of the most levered farms likely crossed into the vulnerable category (above 10 percent) by 2024, even though the overall group average remained just below that threshold.
The bottom panel of Figure 2 indicates that, even as average interest expense ratios have risen for farms above the 50th percentile of the debt-to-asset distribution, their share of principal due within twelve months has remained relatively stable over time, particularly in 2023 and 2024. Less-levered farms (0–25th and 25–50th percentiles) typically report a larger and somewhat more variable portion of their total debt maturing within a year, while the most levered farms (50–75th and 75–100th percentiles) carry a smaller, but more stable share. Taken together with the top panel, this suggests that, on average, the most highly levered farms have not experienced increases in the fraction of debt coming due as large as those below the 50th percentile, but they are devoting a growing and larger share of their gross farm returns to cover their debt servicing costs.
Conclusion
While half of grain farms maintained strong levels of financial efficiency as measured by interest expense ratios of 5% or less throughout the 2019-2024 period, the most leveraged operations—those above the 50th percentile—have seen their average debt servicing costs rise into the cautionary range (5-10%), with some in the vulnerable range (above 10%). Although these highly leveraged farms kept their share of principal due within twelve months relatively stable as interest rates rose, they allocated a much larger share of gross farm returns to cover their interest payments. As the Fed’s rate cutting cycle continues, lower borrowing costs should ease some pressure on cash flows, but the rise in leverage and debt since 2022 suggests that financial stress will remain a concern for a meaningful subset of operations until commodity prices strengthen.
Acknowledgment
The authors would like to acknowledge that data used in this study comes from the Illinois Farm Business Farm Management (FBFM) Association. Without Illinois FBFM, information as comprehensive and accurate as this would not be available for educational purposes. FBFM, which consists of 5,000+ farmers and 70 professional field staff, is a not-for-profit organization available to all farm operators in Illinois. FBFM field staff provide on-farm counsel along with recordkeeping, farm financial management, business entity planning and income tax management. For more information, please contact our office located on the campus of the University of Illinois in the Department of Agricultural and Consumer Economics at 217-333-8346 or visit the FBFM website at www.fbfm.org.
Disclaimer: We request all readers, electronic media and others follow our citation guidelines when re-posting articles from farmdoc daily. Guidelines are available here. The farmdoc daily website falls under University of Illinois copyright and intellectual property rights. For a detailed statement, please see the University of Illinois Copyright Information and Policies here.