


Trends in the Operational Efficiency of the U.S. Ethanol Industry: 2025 Update
The operational efficiency of any industry is key to long-term profitability, no less so for the U.S. ethanol industry. Fortunately, the USDA began publishing the Grain Crushings and Co-Products Production report in October 2014 and this important data source allows us to examine trends in key industry efficiency measures, including gallons of ethanol per bushel of corn, pounds of dried distillers grain with solubles (DDGS) per bushel of corn, and pounds of corn oil per bushel of corn. The purpose of this article is to compute these measures at the aggregate level for the U.S. ethanol industry and to examine trends in the measures over time. This is an update of the analysis of operational efficiency published last year (farmdoc daily, February 26, 2025).
Analysis
To begin, it is important to recognize that two basic technologies—dry mill and wet mill—are used in U.S. ethanol production. A basic overview of the two production technologies can be found here. National ethanol production data from the EIA does not distinguish between dry and wet mill ethanol plants, so the relative importance of the two technologies cannot be estimated from this data. Fortunately, the USDA Grain Crushings and Co-Products Production report includes data on the amount of corn used in ethanol production separately for dry mill and wet mill plants. We can use this data to infer the amount of ethanol produced in the U.S. by the two technologies. Specifically, the USDA data indicate that the amount of corn used by dry mill ethanol plants since October 2014 has ranged from 85 to 93 percent of the total and averaged 92 percent since 2021. This suggests that about 92 percent of U.S. ethanol production in recent years is from dry mill plants and the other 8 percent is from wet mill plants. In the remainder of the analysis in this article we focus on dry mill plants as this is by far the dominant technology used in U.S. ethanol production and it is the technology assumed in previous farmdoc daily articles (e.g., March 5, 2025) that examine the profitability of U.S. ethanol production.
The first operational efficiency measure that we compute is the gallons of ethanol produced per bushel of feedstock processed at dry mill plants. As noted above, monthly fuel ethanol production from the EIA does not distinguish between dry and wet mill ethanol plants. Consequently, we compute the ethanol conversion rate by dividing monthly ethanol production from the EIA by the bushels of corn and sorghum feedstock used at U.S. dry and wet mill ethanol plants from the USDA’s Grain Crushings and Co-Products Production report. Even though this computation is based on data from dry and wet mill ethanol plants, it should be an accurate reflection of the conversion rate for dry mill plants because, as shown earlier, wet mill plants represent less than 10 percent of total ethanol production. Note also that both corn and sorghum feedstock are included in the denominator because fuel ethanol production estimates from the EIA do not distinguish between feedstock used to make the ethanol. The amount of sorghum is usually quite small, typically no more than five million bushels per month, and no sorghum use has been reported since July 2020. By comparison, the amount of corn used in ethanol production generally is in the range of 400 to 500 million bushels per month. Finally, the EIA fuel ethanol production includes denaturant.
Figure 1 shows the estimated aggregate monthly conversion rate for ethanol per bushel of corn and sorghum feedstock at dry mill plants from October 2014 through December 2025, the latest month for which data is available. There is a clear upward trend over time, with the ethanol conversion rate steadily increasing from around 2.80 in late 2014 to a peak of 3.07 in July 2025. This represents about a 10 percent total increase in efficiency, or a gain of roughly 1 percent per year. Note that the linear trend regression shown in Figure 1 explains 65 percent of the variation in the ethanol conversion rate over time. There was a notable dip in the conversion rate during the initial stages of the coronavirus pandemic, but then the rate recovered steadily to a high of 2.98 in August 2024. During the next two years, 2023-2024, the rate moved in a narrow range between roughly 2.90 and 2.95.
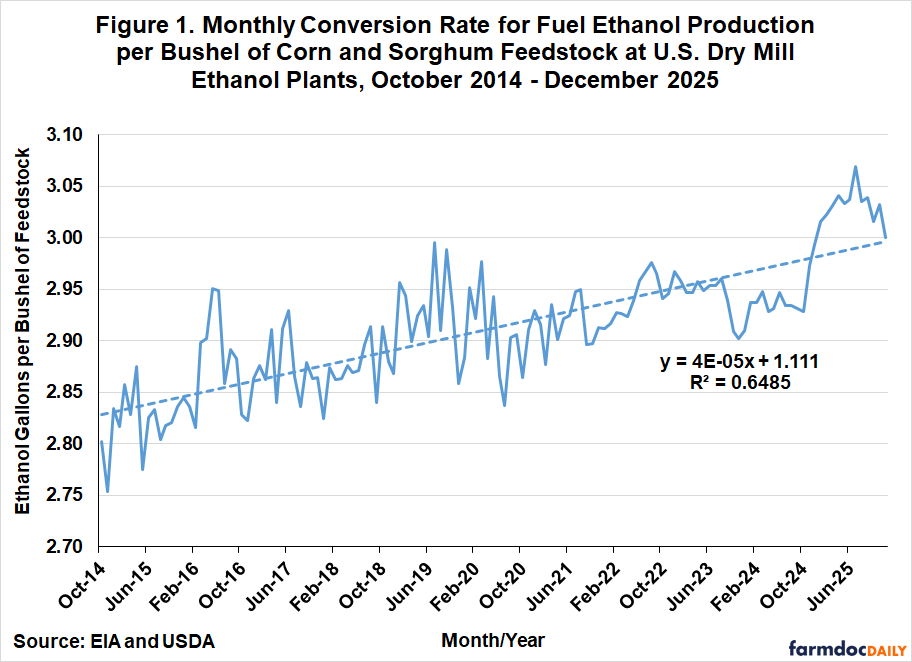
The increase in the ethanol conversion rate during 2025 is striking. For the first time, conversion efficiency averaged more than 3 gallons for an extended period. The sudden departure from the small upward trend over the previous five years suggests something dramatic happened in 2025. Figure 2 provides an important clue as to what might have driven the surge in the ethanol conversion rate. This figure shows monthly generation of D3 cellulosic ethanol RINs from October 2014 through December 2025. Up to March 2024, very small quantities of cellulosic ethanol were produced in the U.S. In March 2024, the U.S. Environmental Protection Agency (EPA) announced new guidelines for ethanol producers to test and document co-production of cellulosic ethanol with corn starch ethanol in order to generate D3 RINs. There are several possible technologies for co-production of cellulosic ethanol, with corn kernel fiber (CKF) technology likely the leader. CKF technology uses specialized enzymes in the fermentation process to convert the fibrous part of the corn kernel into sugars that can be fermented into ethanol. An advantage of CKF technology is that it is does not require new investment in additional physical equipment, such as tankage, because the fermentation of the corn fiber occurs in the same tank used for production of non-cellulosic ethanol. The March 2024 guidelines indicated that the EPA had approved co-processing pathways for 85 ethanol production facilities. This would represent nearly half of the producers in the U.S. The adoption of technologies like CKF is driven by relatively high prices for D3 cellulosic RINs, which averaged $2.34 per gallon in 2025. By comparison, the average price of non-cellulosic ethanol at Iowa ethanol plants averaged $1.64 per gallon.
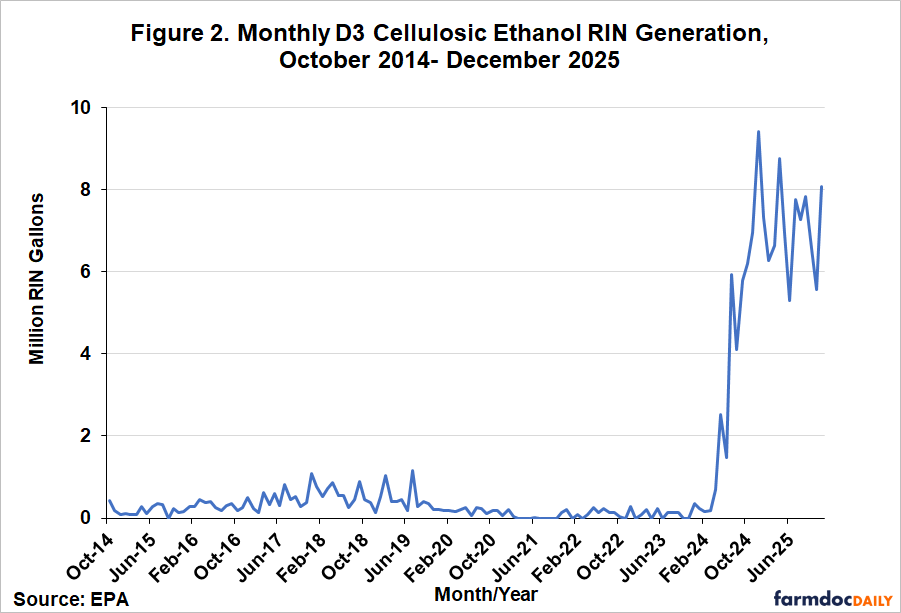
The upward spike in D3 cellulosic RIN generation shown in Figure 2 lines up reasonably well with the surge in the ethanol conversion rate during 2025 shown in Figure 3. In total, 84.3 million gallons of cellulosic ethanol RINs were generated in 2025, representing 2.5 percent of total U.S. ethanol production. Industry sources indicate that CKF technologies generate around 1-2 percent additional yield of ethanol, in the range of the estimated proportion for cellulosic ethanol in 2025.
Given the surge in ethanol production efficiency, an interesting question is the theoretical upper limit on the amount of ethanol that can be produced from a bushel of corn. After all, there is only so much starch and fiber in a bushel of corn that can be converted into ethanol. Practically speaking, most of the starch in the corn kernel has been converted to ethanol at the present time, but residual starch levels in DDGS may offer the potential for further modest improvement. The scientific literature suggests a theoretical limit of 3.0-3.1 gallons of ethanol for 100 percent starch conversion and up to 3.5 gallons if all starch and fiber is converted (e.g., Patzek, 2006; Bothast and Schlicher, 2005). This suggests there is still room for further improvement in the aggregate ethanol conversion rate for U.S. ethanol plants.
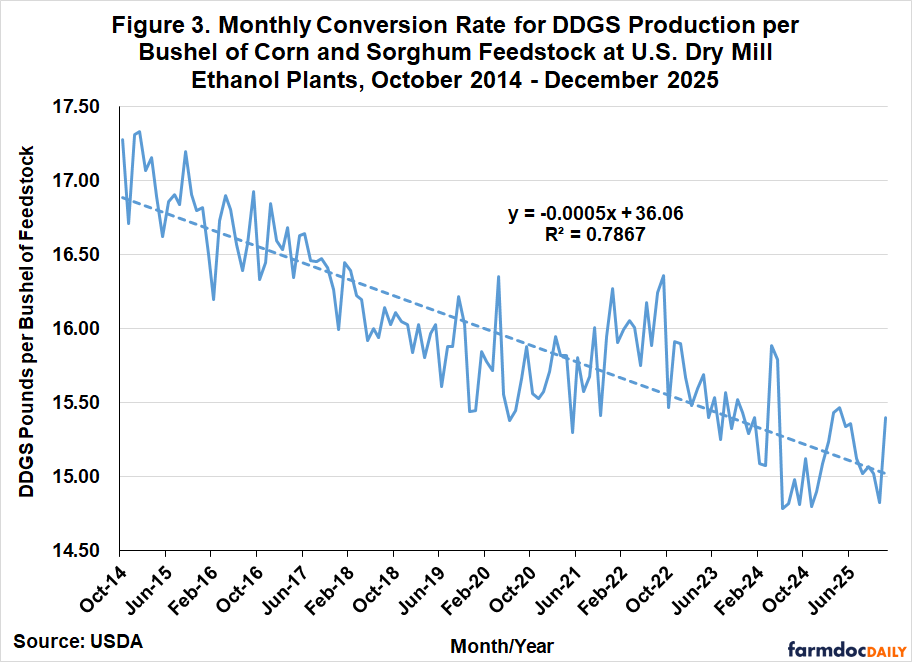
The second operational efficiency measure is the pounds of DDGS produced per bushel of corn and sorghum processed at dry mill plants. Computing the pounds of DDGS produced is complicated by the different types of distillers grains that are produced by dry mill ethanol plants. The Grain Crushings and Co-Products Production report lists five categories of distillers grain co-products for dry mill plants, so assumptions are needed in order to aggregate the different categories on a dry matter equivalent basis. It is assumed that condensed distillers solubles and distillers dried grains are components of DDGS, so we simply sum these two categories without adjustment and add them to DDGS production. We then adjust distillers wet grains with 65 percent or more moisture and modified distillers wet grains with 40 to 65 percent moisture to an equivalent dry matter for DDGS. Since DDGS has 10 percent moisture as a standard, we multiply the quantity of distillers wet grains with 65 percent or more moisture by 0.45 =1–(0.65-0.10) and modified distillers wet grains with 40 to 65 percent moister by 0.70 = 1–(0.40-0.10). We use conservative assumptions for moisture content to avoid under-estimating DDGS production on a dry matter equivalent basis.
Figure 3 shows the resulting aggregate monthly conversion rate for DDGS per bushel of corn and sorghum feedstock from dry mill ethanol plants over October 2014 through December 2025. Just the opposite of ethanol conversion rates, there is a clear downward trend in DDGS conversion rates, with the linear trend regression shown in Figure 2 explaining slightly more than 75 percent of the variation in the DDGS conversion rate over time. The DDGS rate started at 17.34 pounds per bushel of corn in October 2014 and then declined to a low of 14.78 pounds in June 2024. This represents a 2.56 pound drop in DDGS production per bushel of corn, or a 15 percent decline. The DDGS conversion rate appears to have bottomed out since the summer of 2024 lows, averaging 15.12 and 15.20 pounds in 2024 and 2025, respectively.
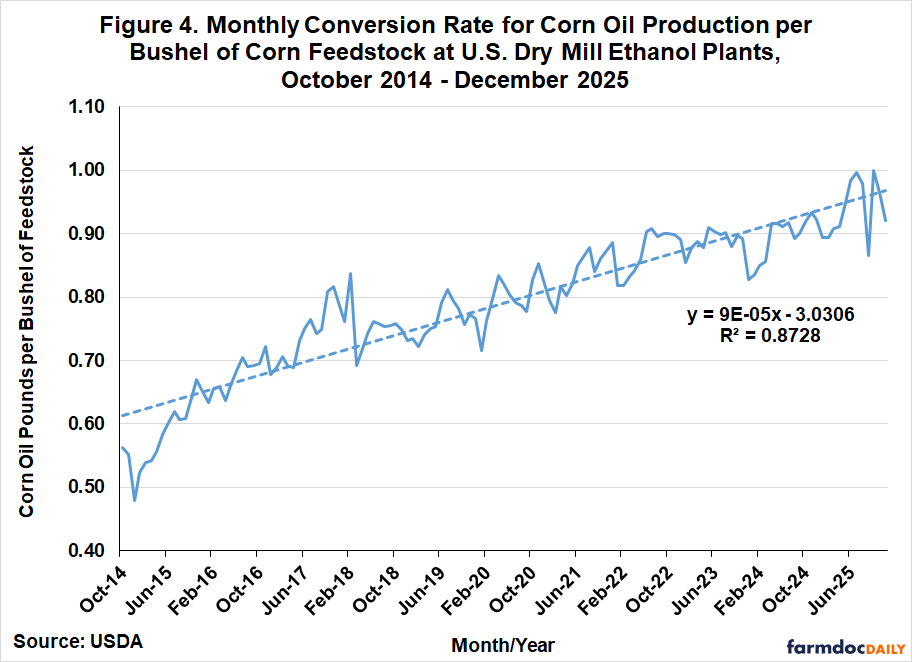
The third measure of operational efficiency is the pounds of corn oil produced per bushel of corn processed at dry mill ethanol plants. This is straightforward to compute as both components are reported directly in the Grain Crushings and Co-Products Production report. Figure 4 shows that the corn oil measure of operational efficiency had a linear trend over the sample period, with a period of very rapid growth from late 2014 through early 2018 and steady growth thereafter. From the trough in December 2014 to the peak in October 2025, the corn oil conversion rate increased from 0.48 to 1.00 pounds per bushel of corn processed, or an increase of slightly more than 100 percent. It is also interesting to note the jump in the corn oil rate that occurred in 2025. By comparison, the rate appeared to reach a maximum of about 0.90 pounds in 2023 and 2024. The average conversion rate in 2025 was 0.94, a 5.4 percent increase over 2023-2024. It is not clear what is driving the recent jump in the corn oil conversion rate.
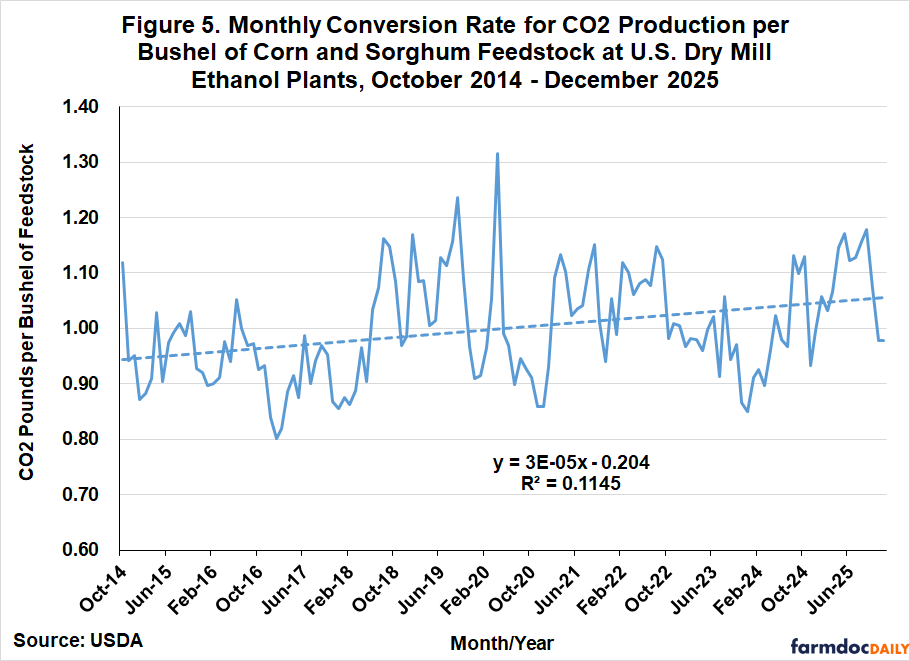
The fourth measure of operational efficiency is the pounds of CO2 produced per bushel of corn and sorghum processed at dry mill ethanol plants. Total CO2 production is aggregated across dry and wet mill ethanol plants in the Grain Crushings and Co-Products Production report, so it is not possible to compute CO2 production separately for dry mill ethanol plants. Using the combined total to represent CO2 production at dry mill plants is, once again, not expected to be a significant limitation because wet mill plants represent less than 10 percent of total ethanol production. Also, note that a technically more accurate description of the computed measure is the number of pounds of CO2 sold, since the amount of CO2 produced in ethanol production dwarfs what is sold into the industrial marketplace (farmdoc daily, February 19, 2024). It is also important to recognize that the CO2 production reported in the Grain Crushings and Co-Products Production report does not include any sequestered volumes. As shown in Figure 5, the computed CO2 measure of operational efficiency is characterized by high volatility, with a peak of 1.32 pounds and a low of 0.80 pounds. There is a small upward trend over time, which mainly reflects a jump in the conversion rate that occurred in mid-2018. Nonetheless, the trend in the CO2 conversion rate over time is small compared to the other rates examined here.
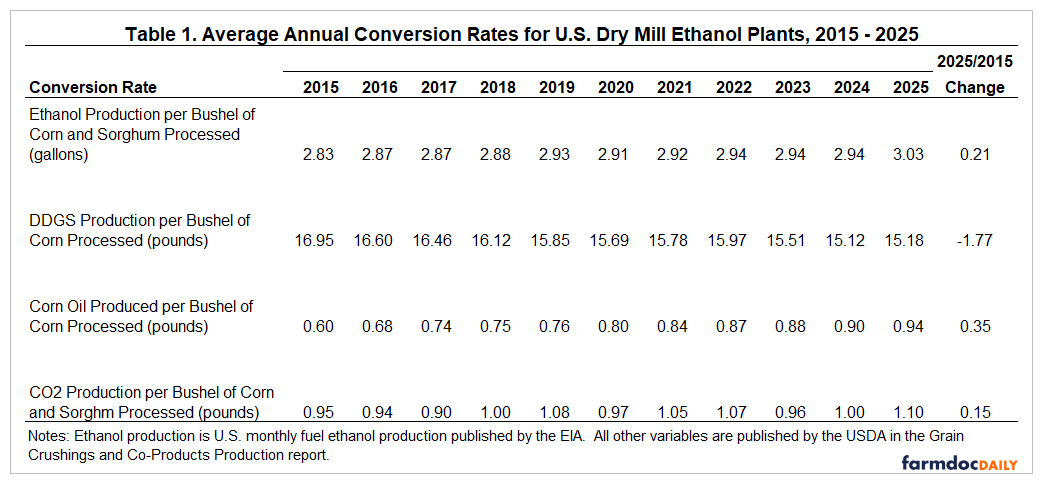
The picture that emerges from this analysis is one of tradeoffs in operational efficiency. These tradeoffs are most easily seen in Table 1, which presents annual averages for the four measures of operational efficiency for ethanol production at dry mill plants. Note that 2014 is omitted because a full year of data is not available from the USDA. Ethanol producers have clearly increased ethanol and corn oil conversion rates at the expense of DDGS conversion rates. Over the last 11 years, producers were able to net an additional 0.21 gallons of ethanol and 0.35 pounds of corn oil for each bushel of corn processed. This came at a cost of 1.77 pounds less DDGS.
Implications
Recent trends in the operational efficiency of the U.S. ethanol industry are analyzed in this article. There is a clear upward trend over time in the ethanol conversion rate, steadily increasing from around 2.80 in late 2014 to a peak of 3.07 in July 2025. The ethanol conversion rate increased markedly in 2025, and for the first time averaged above 3 gallons for an extended period. The most likely explanation for the increase was the announcement of new U.S. Environmental Protection Agency (EPA) guidelines for ethanol producers to test and document co-production of cellulosic ethanol with corn starch ethanol. Just the opposite of ethanol conversion rates, there is a clear downward trend in dried distillers grains with solubles (DDGS) conversion rates over time. The DDGS rate starts around 17.25 pounds per bushel of corn in 2014 and then declines to a low of 14.78 pounds in June 2024. This represents a 2.56 pound drop in DDGS production per bushel of corn, or a 15 percent decline. The DDGS conversion rate appears to have bottomed out since the summer of 2024 lows, averaging 15.12 and 15.20 pounds in 2024 and 2025, respectively. The most rapid gain in operational efficiency is associated with the corn oil conversion rate. From a low in December 2014 to the peak in October 2025, the corn oil conversion rate increased from 0.48 to 1.00 pounds per bushel of corn processed, or an increase of about 100 percent. The picture that emerges from the analysis is one of tradeoffs in operational efficiency of dry mill ethanol plants, with more ethanol and corn oil production coming at the expense of less DDGS.
References
Bothast, R.J., and Schlicher, M.A. "Biotechnological Processes for Conversion of Corn into Ethanol." Applied Microbiology and Biotechnology 67(2005):19–25.
Irwin, S. "2024 Ethanol Production Profits: Regression to the Mean?" farmdoc daily (15):42, Department of Agricultural and Consumer Economics, University of Illinois at Urbana-Champaign, March 5, 2025.
Irwin, S. "Trends in the Operational Efficiency of the U.S. Ethanol Industry: 2024 Update." farmdoc daily (15):37, Department of Agricultural and Consumer Economics, University of Illinois at Urbana-Champaign, February 9, 2025.
Irwin, S. "CO2 Production by the U.S. Ethanol Industry and the Potential Value of Sequestration." farmdoc daily (14):34, Department of Agricultural and Consumer Economics, University of Illinois at Urbana-Champaign, February 19, 2024.
Patzek, T.W. "A Statistical Analysis of the Theoretical Yield of Ethanol from Corn Starch." Natural Resources Research, 15(2006):189–210.
Disclaimer: We request all readers, electronic media and others follow our citation guidelines when re-posting articles from farmdoc daily. Guidelines are available here. The farmdoc daily website falls under University of Illinois copyright and intellectual property rights. For a detailed statement, please see the University of Illinois Copyright Information and Policies here.