


How Do Your Components of Net Worth Stack Up?
Net worth is calculated as total assets minus total liabilities. Liabilities represent claims on your assets by creditors–essentially, the portion of the business they finance. Net worth, therefore, represents the portion of the business that you own.
Much has been written about the current ratio and working capital. These measures indicate the amount of liquid cash (or near-cash assets) available for use. The current ratio is calculated as current assets divided by current liabilities, while working capital is current assets minus current liabilities.
This article goes a step further by examining three components of net worth using data from farms participating in the Illinois Farm Business Farm Management (FBFM) Association. This analysis provides insight into the sources of net worth on the balance sheet. The data is measured at fair market value and spans a 23-year period from 2002 to 2024. All farm types are included: grain, beef, dairy, hog operations.
The ‘current’ component of net worth is working capital (current assets minus current liabilities). Net worth also includes intermediate (intermediate assets minus intermediate liabilities) and long-term components (long-term assets minus long-term liabilities). This article evaluates how these components have changed over time, providing perspective on past economic conditions and helping inform future financial management decisions.
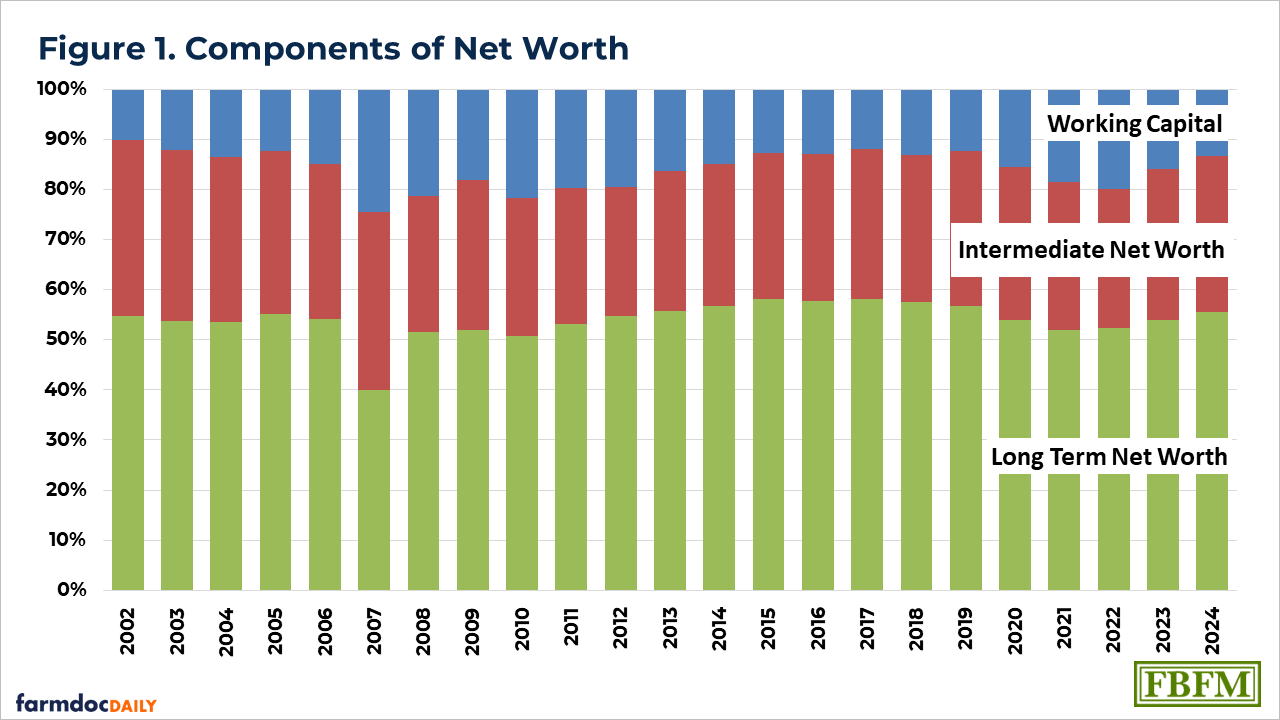
The three components of net worth are expressed as percentages of total net worth and together sum to 100%. Because they are interrelated, an increase in one component must result in a decrease in one or both of the others.
Figure 1 presents these components for each year, illustrating how they change over time.
Working capital as a percentage of total net worth ranged from a high of 25% in 2007 to a low of 10% in 2002. The peak in 2007 coincided with rising grain prices following the ethanol mandate enacted in 2005 and expanded in 2007. Over the 23-year period, working capital averaged 16% and has been declining since 2022. A significant portion of current assets consists of crop inventories and market livestock, which are valued at year-end market prices. As a result, changes in these prices directly affect current assets and, in turn, working capital. Fluctuations in operating loans and accounts payable also influence working capital.
Intermediate-term net worth as a percentage of total net worth ranged from a high of 35% in 2002 and 2007 to a low of 26% in 2012. The 23-year average is 30%, and this component has been increasing since 2022. Intermediate assets are primarily influenced by machinery values and breeding livestock. Changes in intermediate-term borrowing also affect this component of net worth.
Long-term net worth as a percentage of total net worth ranged from a high of 58% in 2015, 2016 and 2017 to a low of 40% in 2007. With the exception of 2007, the long-term component exceeded 50% in all years analyzed. The average over the period is 54%, and it has been increasing since 2020. Rising land values have contributed to this component being above 50%. While long-term debt has also increased over time, land values have grown at a faster rate.
The author would like to acknowledge that data used in this study comes from Illinois Farm Business Farm Management (FBFM) Associations across the state. Without their cooperation, information as comprehensive and accurate as this would not be available for educational purposes. FBFM, which consists of 5,000 plus farmers and 65 plus professional field staff, is a not-for-profit organization available to all farm operators in Illinois. FBFM field staff provide on-farm counsel with recordkeeping, farm financial management, business entity planning and income tax management. For more information, please contact the State FBFM Office located at the University of Illinois Department of Agricultural and Consumer Economics at 217-333-8346 or visit the FBFM website at www.fbfm.org.
Disclaimer: We request all readers, electronic media and others follow our citation guidelines when re-posting articles from farmdoc daily. Guidelines are available here. The farmdoc daily website falls under University of Illinois copyright and intellectual property rights. For a detailed statement, please see the University of Illinois Copyright Information and Policies here.