


Recent Trends in Biodiesel Prices and Production Profits
In a post on July 19th of this year we examined the reasons for RINs prices that were “going wild” at the time. We showed that if the RFS renewable (ethanol) mandate exceeds the E10 blendwall then the gap effectively becomes an additional biodiesel mandate due to the nesting provisions of the Renewable Fuels Standard (RFS). Since D6 ethanol RINs are valued as D4 biodiesel RINs in this circumstance, we argued that if one wanted to understand the pricing of ethanol RINs one had to dig into pricing in the biodiesel market. We showed that biodiesel prices had been on a tear relative to diesel prices through mid-July and this was the reason that all RINs prices had been surging. In today’s post we explore the impact of the surging biodiesel prices on the profitability of biodiesel production.
We begin by reviewing the latest data on biodiesel and diesel prices. Figure 1 shows the weekly wholesale price of biodiesel and ultra low sulphur diesel (ULSD) at Chicago between from April 3, 2008 through September 13, 2013. Since peaking in mid-July biodiesel prices have fallen by about 50 cents per gallon, while at the same time ULSD prices have risen about 15 cents per gallon. This has substantially lessened blending losses for biodiesel (net of the $1 per gallon tax credit) and explains why D4 RINs prices have been essentially halved since the mid-July peak. The next question is whether the recent downturn in biodiesel prices has dampened the profits of biodiesel producers.

In order to assess biodiesel production profitability over time, we use a model of a representative Iowa plant developed at Iowa State University by Don Hofstrand. The model incorporates these key assumptions:
- 30 million gallon annual biodiesel production capacity
- Plant construction cost of $1.57 per gallon of nameplate capacity
- 50 percent debt and 50 percent equity financing
- 8.25 percent interest on 10-year loan for debt financing
- Plant operates at 100 percent of nameplate capacity
- Plant only processes soybean oil into biodiesel
- Conversion factor of 7.55 pounds of soybean oil per gallon of biodiesel
- 0.9 pounds of glycerin co-product per gallon of biodiesel
- 7 cubic feet of natural gas per gallon of biodiesel
- 0.71 pounds of methanol per gallon of biodiesel
- Other variable input costs of 25 cents per gallon of biodiesel
- Total fixed costs of 26 cents per gallon of biodiesel
This model is meant to be representative of an “average” plant constructed since 2007 to process soybean oil into biodiesel. There is certainly substantial variation in capacity, production efficiency, and feedstock across the industry and this should be kept in mind when viewing profit estimates from the model. However, limiting the feedstock to soybean oil is reasonable since it represents about 60 percent of all feedstock used to produce biodiesel in the U.S.
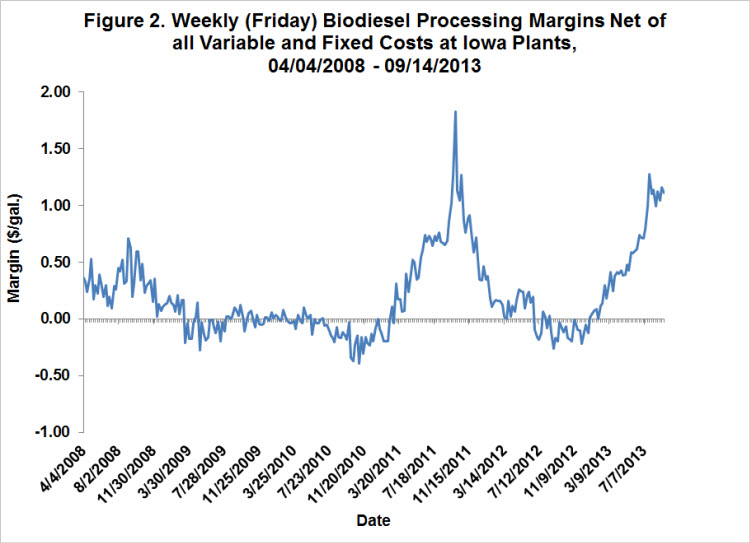
To track plant profitability over time, weekly biodiesel and soybean oil prices at Iowa plants from the Agricultural Marketing Service (AMS) were collected starting in 2008. Natural gas costs are estimated based on monthly data from the Energy Information Agency (EIA). Glycerin and methanol prices were obtained from OPIS. Figure 2 presents the (pre-tax) estimates of biodiesel processing margins based on the prices and model assumptions. Profits net of all variable and fixed costs have been essentially zero except for two spikes. The first spike occurred in March – December 2011 and is directly attributable to the race by diesel blenders to take advantage of the blender tax credit that was set to expire at the end of 2011. The second and current spike started in January 2013. There are likely two explanations for the current spike. First, diesel blenders once again are motivated to incentivize an increase in the production of biodiesel during 2013 to take advantage of the blenders tax credit that was reinstated for this year only. It is uncertain whether it will be extended for 2014. Second, the biodiesel mandate under the RFS was expanded by the EPA from 1 billion gallons in 2012 to 1.28 billion gallons in 2013 and there may be a need for additional production above the mandate in 2013 in order to meet parts of the advanced and renewable mandates (the latter was discussed above).
We now examine biodiesel prices and production profits together. This is done in Figure 3, which presents the biodiesel price at Iowa plants (slightly different price series than the Chicago price series in Figure 1) and a simple version of the breakeven profit relationship between soybean oil and biodiesel prices. Since soybean oil represents over 80 percent of the variable operating costs of the representative plant, all other costs are lumped into the constant term of 0.60, or 60 cents per gallon of biodiesel produced. The 7.55 slope is just the number of pounds of soybean oil required to produce a gallon of biodiesel. One can readily observe that the line for the breakeven relationship tracks the biodiesel price very closely except for the two episodes outlined above. This is just another way of saying that the market has typically priced biodiesel based on the cost of soybean oil, a markup for other variable and fixed costs, and zero profits. Another implication is that the prices of biodiesel and soybean oil track one another very closely outside of the previously mentioned periods in 2011 and 2013.
Figure 3 also reveals the key observation that the price of biodiesel has risen substantially in relation to the price of soybean oil during the periods of spiking profits. This has been especially true since the beginning of 2013, when biodiesel prices increased by nearly a dollar and the breakeven price (scaled soybean oil prices) dropped about 30 cents. The figure also helps to explain why biodiesel production profits have only dropped slightly since mid-July in the face of falling biodiesel prices. The sharp drop in soybean oil prices has more than offset the decline in biodiesel prices, thus propping up margins.

Implications
The biodiesel market is now playing an important role in determining the price of RINs. Diesel blenders have bid up the price of biodiesel since the beginning of the year substantially in relation to the price of soybean oil, the main feedstock used to make biodiesel in the U.S. In combination with falling soybean oil prices this has driven biodiesel production profits to levels rarely seen in recent years. In a future post we will take a look at the impact of the rising profits on the quantity of biodiesel produced. The response of supply to prices and profits is an important piece of information in light of the potential role of biodiesel in meeting RFS mandates in the future.
Disclaimer: We request all readers, electronic media and others follow our citation guidelines when re-posting articles from farmdoc daily. Guidelines are available here. The farmdoc daily website falls under University of Illinois copyright and intellectual property rights. For a detailed statement, please see the University of Illinois Copyright Information and Policies here.