


The Forgotten Variable: Yield and the Choice of Farm Program Option
Background
Price has been the focus of almost all discussions about the one time irrevocable opportunity to choose among Agriculture Risk Coverage – county (ARC-CO), Agriculture Risk Coverage – individual (ARC-IC), and Price Loss Coverage (PLC). This article instead focuses on the forgotten variable: yield. It concludes yield can play an important role in the decision.
Yield Types Impacting Farm Program Choice
- Program Yield – fixed yield on file with Farm Service Agency (FSA) used to calculate PLC payments
- This yield will be either (1) updated program yield [90% of average yield on FSA farm for 2009-2012], (2) current program yield [default yield], or (3) FSA yield update replacement yield [75% of 2008-2012 average yield for county].
- Yield component of ARC benchmark revenue – 5-year Olympic average [removes low and high] yield per planted acre in county (ARC-CO) or yield per planted acre for ARC-IC farm unit
- Yield per planted acre in county or farm – component of crop year revenue for county (ARC-CO) of ARC-IC farm unit and thus impacts payment by ARC-CO and ARC-IC, respectively.
Yield Consideration I – Updated Program Yield vs. County Average Yield
- The higher the program yield relative to county average yield, everything else constant; the more attractive is PLC relative to ARC-CO.
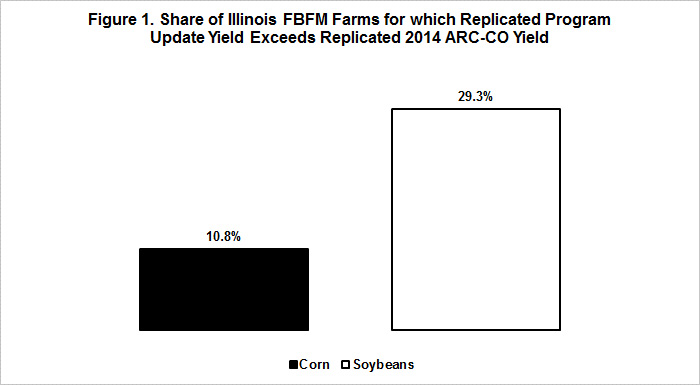
- Farm yield data for farms that had a complete set of yield data for the 2009-2012 crop years in the Illinois Farm Business Farm Management (FBFM) program were used to replicate the updated program yield option – 90% of the simple average of farm yield from 2009 through 2012. County yield data from the U.S. Department of Agriculture (USDA), National Agriculture Statistics Service (NASS) Quick Stats data base were used to replicate the ARC-CO yield component for the 2014 crop year – Olympic average of yields for 2009 through 2013 for the county in which the FBFM farm was located. For 11% of the FBFM farms with corn, the replicated program update yield exceeded the replicated ARC-CO yield component (see Figure 1). The comparable number for soybeans was 29% of FBFM farms with soybeans. These results for FBFM farms suggest that the ARC-CO yield component will likely exceed the PLC program yield for most, but not all, Illinois farms. Thus, everything else the same, the level of yield will most likely favor ARC-CO for most farms in Illinois.
Yield Consideration II – Growth in Yield
- Both ARC programs use a moving average of yield whereas PLC uses the fixed program yield.
- There is no reason at present not to expect that, given normal weather, yields should continue their historical up trend through 2018. As a result, ARC’s yield component and thus benchmark revenue should increase on average through 2018.
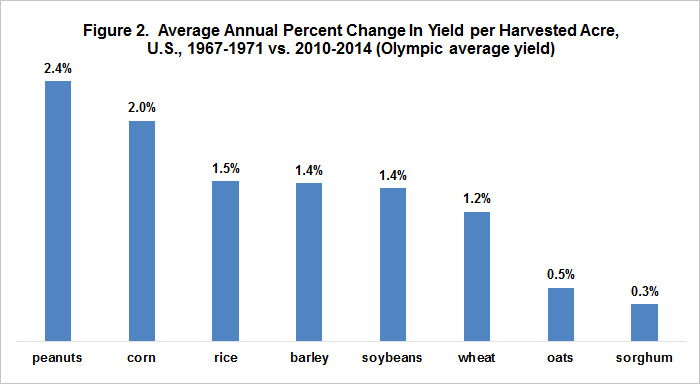
- Yield trends have varied by crop (see Figure 2). Thus, at the aggregate crop level, the method used to calculate ARC’s yield component has the most value for peanuts and corn and the least value for oats and sorghum.
Yield Consideration III – Farm Average Yield vs. County Average Yield
- ARC-CO and ARC-IC pay on 85% and 65%, respectively, of program base acres. Thus, for ARC-IC to be a competitive option some factor or factors have to compensate for ARC-IC’s fewer payment acres.
- One potential compensation is an ARC-IC yield benchmark component that is (much) higher than the ARC-CO yield benchmark component and the PLC farm payment yield. If 1 program crop and the same percent payment rate for both ARC programs are assumed, the ARC-IC yield benchmark component needs to be more than 30% higher than the county yield benchmark component in order for ARC-IC to pay more than ARC-CO. Other situations result in a different breakeven yield. Using the Illinois FBFM farm and USDA Quick Stats county data sets to replicate ARC-CO and ARC-IC Olympic average yields for the 2008-2012 crops, the ARC-IC benchmark yield component exceeded the ARC-CO benchmark yield component by at least 30% on 3% and 5% of FBFM farms with corn and soybeans, respectively (see Figure 3). This simple analysis suggests a relatively small number of farms may find ARC-IC of interest due to higher farm than county yields.
- Other potential compensations are a FSA farm with highly variable yields and the planting of fruits and vegetables on the farm. These compensations are discussed in more detail in the June 6, 2014 farmdoc daily article by Carl Zulauf and Gary Schnitkey, “2014 Farm Bill: Making the Case for Looking at ARC-Individual Farm.“

Yield Consideration IV – Variability of Farm Yield to County Yield
- County yield is less variable than individual farm yield because it is an average across the diverse array of agro climates, farm management styles, and production systems in a county.
- However, the relevant variable for comparing ARC-CO and ARC-IC is the variation in the ratio of farm and county yield to the 5-year average yield used to calculate the ARC revenue benchmark. Average yield also varies, potentially offsetting some variation in farm and county yield.
- Figure 4 presents for the 1977-2012 crops, the average absolute variation in yield for an FBFM farm and its associated county relative to the 5-year average for the FBFM farm and county. Due to availability of data, the average is a simple average and not the Olympic average of yield used by ARC-CO. Usually the difference between the simple and Olympic average is not large. For corn, on average, farm yield for a year was 18% different than the 5-year average for the farm for that year. It may have been lower or higher, but the average difference was 18%. In comparison, the average absolute difference for corn county yield was 16%, or 11% less variable than farm yield relative to the farm average. Average absolute difference for soybean county yield was 11%, or 26% less variable than the farm level variability. These results suggest that on average yield variability is higher for corn than soybeans and for a farm than county. However, the difference in variability between farm and county is not huge. Thus, while higher yield variability at the farm level gives ARC-IC an advantage over ARC-CO, especially for corn; the advantage is not sizable in Illinois in general. Moreover, if more than 1 crop is planted on the ARC-IC farm unit or if the producer has more than 1 FSA farm in a state enrolled in ARC-IC, revenue is averaged over all program crops planted on the entire ARC-IC farm unit, further dampening the difference between variability for the ARC-IC farm unit and the county.

Summary Observations
- Price has received most of the attention in discussions over which farm program option to choose. However, yield is also a factor.
- When examining ARC-IC, a consideration is whether yields on the ARC-IC farm unit are much higher than the associated county yields in order to compensate for ARC-IC’s 20% fewer payment acres. A simple analysis suggests a relatively small number of farms may find ARC-IC of interest due to higher farm than county yields.
- Diversification is a common strategy when managing uncertainty. Thus, farmers with multiple FSA farms may want to consider diversifying their farms across programs. If diversification is desired, yield comparisons can be useful in making the diversification decision. Everything else the same, ARC-CO is more attractive for FSA farms when county yield is high relative to yield for the FSA farm. PLC is more attractive for FSA farms when payment yield is high relative to both the county and farm Olympic average yield.
- Remember future yield is not known with certainty. It is not unreasonable to expect that yield will be below trend in at least one of the 2015-2018 crop years.
- It is not clear that variability of yield relative to its 5-year average is all that much larger on average in Illinois for the farm than for the county. This finding suggests consideration should be given to how to appropriately assess FSA farm yield variability relative to county yield variability.
- In sum, the various yields that affect payments by a farm program option matter. How much weight should be assigned to these different yields and to yield in general depends on the farmer and the farm. But, to not think about yield is to potentially end up with a misguided farm program choice.
The authors thank the Illinois Farm Business Farm Management (FBFM) program for the farm level data used in this analysis.
This publication is also available at http://ohioagmanager.osu.edu.
References
Zulauf, C., and G. Schnitkey. "2014 Farm Bill: Making the Case for Looking at ARC-Individual Farm." farmdoc daily (4):105, Department of Agricultural and Consumer Economics, University of Illinois at Urbana-Champaign, June 6, 2014
Disclaimer: We request all readers, electronic media and others follow our citation guidelines when re-posting articles from farmdoc daily. Guidelines are available here. The farmdoc daily website falls under University of Illinois copyright and intellectual property rights. For a detailed statement, please see the University of Illinois Copyright Information and Policies here.