


Performance of Publicly-Traded Agricultural Firms Since 2007
The crop farming sector has been relatively profitability in the past several years while the general economy has gone through a great deal of turmoil. As financial difficulties became apparent in 2008, most publicaly-traded companies saw their stock prices decline. In this article, we examine how the stock prices of publicly-traded companies dealing with agriculture performed since 2007. Did agricultural companies experience declines similar to most other companies? Or did their stock prices perform better as a result of profitability within the crp farming sector?
To evaluate how stock prices performed, an “AgIndex” representing the market value of “agricultural” companies was constructed. The AgIndex was compared to the S&P 500, an index that tracks the market values of 500 large companies in the United States. The AgIndex experienced a decline in value in 2008 larger than the S&P 500. Since 2008, stock prices of companies in the AgIndex rose more than the S&P 500. Overall, the AgIndex increased more since 2007 than did the S&P 500.
Construction of the AgIndex
Twenty-one publicly-traded companies were identified as having business segments that provided or used products from crop farms (see Table 1). These companies were divided into five sectors:
1. The fertilizer sector contains companies involved in the manufacture and distribution of fertilizers and includes Agrium Inc., CF Industries, Intrepid Potash, Mosaic Company, and Potash Corporation.
2. The equipment sector contains companies involved in the manufacture of agricultural equipment and includes AGCO Corporation, Art’s Way Manufacturing Company, Caterpillar Inc., CNH Global, Deere & Company, Kubota Corporation, and Lindsay Corporation.
3. The seed & genetics sector contains companies that produce seeds and includes Monsanto and Syngenta.
4. The crop protection sector includes companies that produce products aiding plant growth and includes Dow Chemical, DuPont, and FMC.
5. The first processor sector contains companies that are the first processors of corn and soybeans and include Andersons, Archer Daniels Midland, Bunge, and Corn Products International.

Two notes about these companies and their classifications. First, companies range in specialization. Some companies, such as Monsanto, have a total focus on agriculture. Other companies, such as Dow Chemical Company, have many business interests outside of agriculture. Hence, the performance reflected by the AgIndex will be impacted by business segments outside of agriculture. Second, the classification into sectors is not straightforward as some companies have products that span sectors. For example, DuPont produces both crop protection products and seeds through its subsidiary Pioneer. Similarly, Bunge Limited has grain processing interests as well as fertilizer interests.
The AgIndex was calculated in the same manner as the S&P 500. The market value (i.e., market capitalization) of each company was found by multiplying number of shares outstanding times the price of each share. Shares outstanding were obtained from each company’s quarterly filing with the U.S. Securities and Exchange Commission. Stock prices were obtained from Yahoo Finance. Each quarter, each company’s market capitalization was summed to arrive at total market value for companies within the AgIndex. The total market value was then divided by a number so that the AgIndex value equaled 100 at the beginning of the 1st quarter of 2007. Values for the AgIndex were found for the beginning of each quarter from the beginning of the first quarter 2007 until the beginning of the second quarter 2011.
Note that both the AgIndex and S&P 500 are based only on market values and do not include dividends in their calculations. As a result, the index reflects returns only from changes in market values. For both the AgIndex and S&P 500, the index values understate total returns.

AgIndex Compared to the S&P 500
The AgIndex and S&P 500 moved together during the time period examined (see Figure 1), with quarterly values having a 0.81 correlation coefficient. Both indexes increased in 2007, then declined dramatically in 2008, reaching lows in the second quarter of 2009. During 2008, companies in the AgIndex had market value declines slightly larger than firms within the broader S&P 500. From the second quarter of 2009, both index values increased until the second quarter of 2010. From the second quarter 2010 level, both indexes fell in the third quarter in 2010. Both indexes increased in the third and fourth quarters in 2010, and in the first quarter 2011.
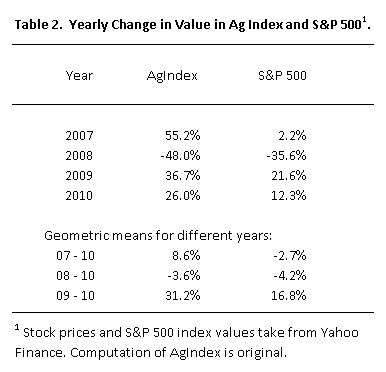
While correlated, there have been differences in market value changes between the AgIndex and the S&P 500. Yearly changes in market value for the AgIndex were 55.2% in 2007, -48.0 percent in 2008, 36.7 percent in 2009, and 26.0 percent in 2010 (see Table 2). Yearly changes in the S&P 500 were 2.2 percent in 2007, -35.6 percent in 2008, 21.6 percent in 2009, and 12.3 percent in 2010. In all but 2008, the change in the AgIndex was higher than the S&P 500.
A geometric mean indicates the average yearly increase in funds given that a specified amount was invested at the beginning of the period. The geometric mean for the AgIndex from the beginning of 2007 to the end of 2010 was 8.6%. Had funds been invested in stocks in the same proportion as the AgIndex at the beginning of 2007, the market value would have increased by the end of 2010 by 8.6 percent per year. The 8.6 percent AgIndex change is greater than the S&P 500, whose geometric mean was -2.7 percent. Geometric means were calculated for 2008 through 2010 and 2009 through 2010. In all cases the AgIndex geometric mean was greater than the S&P 500 geometric mean (see Table 2). For 2008 through 2010, the AgIndex annual change was -3.6 percent compared to -4.2 percent for the S&P 500. For 2009 through 2010, the AgIndex annual change was 31.2 percent compared to 16.8 percent for the S&P 500. Judging by these geographical means, market values of companies in the AgIndex have increased more than firms in the S&P 500.

Sector Performance within the AgIndex
Market value changes of sectors within the AgIndex vary considerably (see Figure 2). The sector with the highest increase from 2007 through 2010 was the fertilizer sector, more than doubling market values. Fertilizer demand increases and merger activities likely led to higher market value of firms within the fertilizer sector. The equipment sector has the second highest increase with a 51 percent increase followed by seed and genetics with a 37 percent increase. Strong sales of equipment and seed existed over the past several years, partially due to higher farm incomes and increasing acreages in row crop production.
Two sectors had decreases from the beginning of 2007 to the end of 2010. There was a two percent decrease in the crop protection sector and a four percent decrease in the first processor sector. These sectors did relatively well in the first quarter of 2011, having increases that caused the second quarter 2011 value to exceed the first quarter 2007 value.
Summary
As a group, the market values of publicly traded firms within the AgIndex exceeded those of S&P 500 in the last five years. Since 2008, market value changes have been larger for AgIndex than for the S&P 500. Like crop farms, many agricultural firms have performed well in the period of higher commodity prices.
Market values varied across sectors. Fertilizer, equipment, and seed & genetic sectors had large increases in market values. These firms supply products to farmers, who have generally had above-average incomes. Farm’s having above average incomes likely led to higher demand for fertilizer, equipment, and seed & genetic sectors. The sector that had the lowest market value increase from 2007 was the first processor sector. This sector purchases inputs from grain farms and higher commodity prices may have played a role in lower market values.
Disclaimer: We request all readers, electronic media and others follow our citation guidelines when re-posting articles from farmdoc daily. Guidelines are available here. The farmdoc daily website falls under University of Illinois copyright and intellectual property rights. For a detailed statement, please see the University of Illinois Copyright Information and Policies here.