Prevented Planting Calculator Released as Part of FAST Planting Decision Model
A prevented planting calculator is available from farmdoc that compares net returns from prevented planting, planting corn, and planting soybeans. The calculator is part of our FAST decision series which are Microsoft Excel spreadsheets. The calculator is called the “Planting Decision Model” and can be downloaded from the FAST section of farmdoc or can be directly download from here .
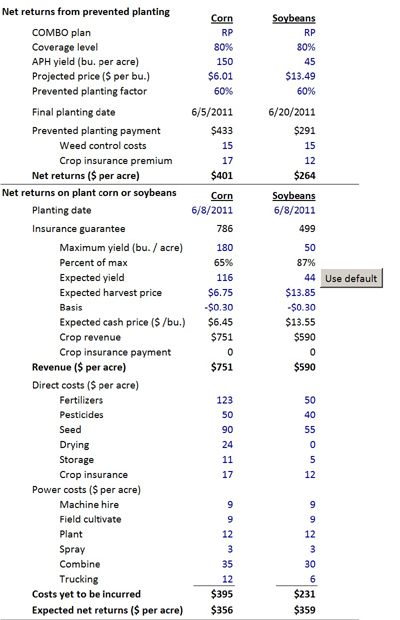
The nearby graphic shows a screen shoot of the main section of the calculator. All input are in blue. The calculator has two main sections 1) net returns from prevented planting and 2) net returns on planting corn and soybean.

Net returns from prevented planting
The “net returns from planting” section requires input that details the insurance plan selected. This includes the name of the plan, coverage level, APH yield, projected price, and prevented planting factor. In the example, a 60% prevented planting factor is used. At signup time, a farmer could have chosen to buy-up prevented planting coverage to either 65% or 70%. Buy-up prevented planting coverage comes with higher premium.
- Final planting date is the date at which prevented planting can be taken and the date at which insurance guarantees begin to decline. Final planting dates are county specific. Users entered their county in earlier input.
- Prevented planting payment equals coverage level times APH yield times projected price times prevented planting factor.
- Net returns equal prevented planting payment minus costs of taking prevented planting. Net returns from prevented planting can be compared to planting corn or planting soybeans.
Net returns from planting corn or soybeans
In this section, net returns from planting corn and planting soybeans are estimated. A user enters yields, prices, and incremental costs. Main features of this section include:
- Insurance guarantee is calculated and will decrease once the final planting date has been reached. The insurance guarantee is reduced one percent for each day planting takes place after the final planting date. The guarantee reaches its low point of 60% of the initial guarantee after 25 days have passed from the final planting date. The “planting date” input determines the guarantee reduction.
- Expected yield is estimated by the model to equal maximum yield times percent of max. The percent of max is estimated by input not shown in the graphic. Users can override the expected yield estimated by the calculator.
- Crop insurance payments are estimated by the model based on the insurance policy selected, as well as expected yield and expected harvest price.
- Revenue equals crop revenue plus crop insurance payment.
- Incremental costs should be entered. These give costs that will be incurred if planting takes place. Note that costs has been incurred already should not be entered. An example is nitrogen fertilizer. If nitrogen fertilizer has been applied, its costs should not be included.
- Expected net returns are useful for comparison. Planting corn is projected more profitable than prevented planting when expected net returns from planting corn exceed net returns from prevented planting, and vice versa.
Not shown in the graphic are sensitivity tables. The model includes two sensitivity tables, one for corn and one for planting soybeans. The sensitivity tables show net returns for different harvest prices and actual yields.
Disclaimer: We request all readers, electronic media and others follow our citation guidelines when re-posting articles from farmdoc daily. Guidelines are available here. The farmdoc daily website falls under University of Illinois copyright and intellectual property rights. For a detailed statement, please see the University of Illinois Copyright Information and Policies here.


