


Farm Liquidity – A Buffer for Volatile Revenue and Costs
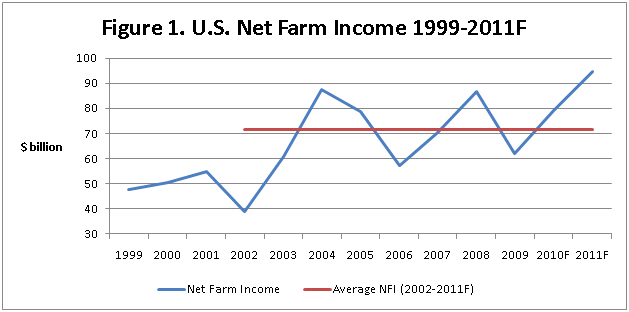
Commodity price volatility and yield uncertainties combined with large swings in input costs have resulted in high but volatile farm earnings. In general, the profitability of farms in the U.S. and Cornbelt has been strong the past decade. The top five years in U.S. farm earnings for the past 30 years have occurred since 2004 (Figure 1). USDA forecasts farm earnings to be $94.7 billion in 2011, up almost 20% from the 2010 forecast and the second-highest inflation adjusted level in the past 35 years.
Farm input costs have also increased steadily the past decade. The average nonland costs to grow corn in Central Illinois on high productivity land increased from $335 per acre in 2005 to $515/acre in 2010 resulting in higher needs for access to capital. The increased earnings volatility and higher costs have placed a higher premium on maintaining farm liquidity. As farms increase in size, liquidity needs also increase.
Liquidity refers to the ability to generate cash to meet short-term obligations. Three commonly cited motivations for farms to hold liquidity are (1) the transaction motive, (2) the precautionary motive and (3) the speculative motive. Motivations differ across management style, farm type, borrower age, farm size and risk tolerance of the borrower.
Transaction motive is the need to hold cash to satisfy normal payments. Livestock operations have a higher volume of cash transactions.
Precautionary motive is the need to hold liquidity to act as a buffer or financial reserve for unanticipated cash demands. Given the high volatility of farm earnings, liquidity provides a good buffer for potential downturns in revenue.
Speculative motive is the need to hold cash to take advantage of additional investment opportunities when they become available. Farmers may want to maintain liquidity to have the flexibility to make capital purchases like land and machinery.
Although recent profitability has been strong, there are continued concerns regarding a potential downturn in the agricultural economy and the ability of farm operations to withstand earnings stress. When cash flows and earnings are stressed, a source of loan repayment is liquidity reserves. One measure of liquidity is working capital expressed relative to value of farm production (gross revenue). Working capital is simply current assets (cash and equivalents, inventories, supplies, etc.) less current liabilities (accounts payable, debts due within the next 12 months, etc.). This ratio is a particularly useful because more working capital is needed as revenue and size of an operation increases.
Figure 2 shows the trends in liquidity for Illinois Farm Business Farm Management farms since 2006. The two bars represent the 25% and 50% percentiles of producers. The 25% percentile level indicates that 25% of the farms have a value lower than the specified value while the 50% percentile represents the value where one-half of farms have values above and one-half of farms have values below the specified level. The general trend is an increase in farm liquidity from 2006 to 2010 indicating that some of the recent farm profitability has been used to enhance liquidity reserves. The 50% levels also indicate very strong levels of liquidity for farms. In general, a 30% working capital to revenue is considered strong while levels in the 10% to 30% range are viewed as adequate by most lenders.

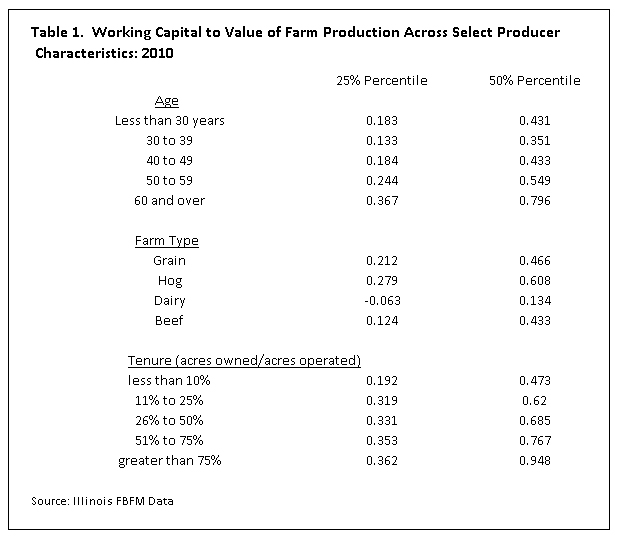
Liquidity positions vary across different types of farms. The levels of liquidity for farms by age, farm type and tenure position are shown in Table 1. Liquidity tends to increase by age and by farms that tend to own a higher percentage of the acres they farm. Dairy farms hold the lowest level of liquidity. The higher frequency of cash inflows typically allow dairy farms to operate at lower levels of liquidity.
In summary, Illinois farms have generally improved their liquidity levels over the past five years. Improved liquidity is simply another risk management strategy farms can use to mitigate potential downturns in the agricultural economy and provide financial flexibility for future cash flow volatility.
Disclaimer: We request all readers, electronic media and others follow our citation guidelines when re-posting articles from farmdoc daily. Guidelines are available here. The farmdoc daily website falls under University of Illinois copyright and intellectual property rights. For a detailed statement, please see the University of Illinois Copyright Information and Policies here.