Some “Random” Thoughts About Corn Prices
This season has witnessed fairly high prices and volatile corn price movements, driven at different times and degrees by a late and wet planting season, slow planting progress, acreage expectation slippages and offsetting later gains, surprises in stocks reports, the recent (and upcoming) WASDE releases, and uncertainty surrounding implications of removal of the ethanol blend credit but retention of the RFS mandate — and ever important future weather uncertainties. With the possible exception of the summer of 2008, the importance of understanding and managing future price risk likewise seems to be at an all time high, and the importance of forming accurate expectations about future random prices equally important.
Futures prices are fairly well understood to be the market’s best aggregated estimate of the level of prices at the future expiration date. The changes in those expectations through time are the results of changes in information sets — the resolution of uncertainty about events and conditions as they pass, and changes in possible risks affecting supply and demand in the future. The relative degree to which prices fluctuate through time is a measure of the uncertainty or volatility in the process leading to eventual prices. This degree of randomness can be described in many ways, but perhaps most conveniently is stated in terms of the standard deviation per unit of time, or the associated probabilities of future prices being at different distances from their current prices.
Options markets are designed to allow individuals to trade on their beliefs about the these possible future price paths which in turn provides a convenient means to recover a fairly accurate probabilistic representation of possible prices. In short, higher volatility leads to more expensive insurance against price movements, and hence more expensive options that have higher expected payments. This fact, and the design of options markets with puts and calls traded across a set of uniformly aligned strike prices provides a direct means to understand the implications of volatility. For context, our current estimate of the annualized volatility in the December 2011 corn futures market is running about 33.6%, down recently, and substantially lower than its value of about 39.8% in mid March. This value is standard deviation divided by current price, so a 33.33% volatility when prices are $6.00 associates the same likelihood for a $2.00 price swing as a $1.00 price swing when starting prices are $3.00.
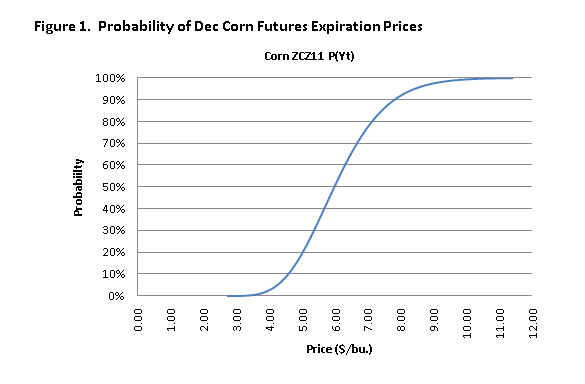
Using settlement data from 7/6/2011 and a tool developed at the University of Illinois to recover futures price distributions from options data, we can systematically assess the market’s current sense of the likelihood of different sized price movements between now and the expiration of the Dec 2011 contract against which much production is hedged, and against which federal crop insurance contracts are settled. The Dec Futures contract settled at $6.085, but price distributions are not symmetric, and the options prices imply that final prices in about 53% of the cases will be at or below current prices (they cannot drop below zero for example, and equal size price drops and increases are not viewed as identically likely, so the “average” is not always in the center of the price distribution). Working the other way, suppose you had a breakeven price of $5.00 and were interested in understanding the likelihood of prices dropping below that value. Given the market’s best estimate today, the options data imply that there is a 19.3% chance that expiration prices for the Dec futures will be below $5.00. On the upside, there is a 25% chance that prices will be above $6.89 implied in the same set of current prices.
Figure 1 below summarizes the probabilities associated with a wide range of possible future prices. It can be interpreted by selecting a price on the lower axis and reading straight up to the point on the blue line that associates the fraction of cases for which prices will be at or below that level at expiration. Equivalently, starting at a probability of 10% the associated price is $4.59, meaning that the options markets associate a 10% likelihood for expiration prices to be below $4.59.

The following table provides similar information in a related format with the left hand side relating probabilities of interest to associated prices, and the right hand side relating prices of interest to their associated probabilities.

So while future prices are in fact random, we can still understand a great deal about the degree of risk exposure faced by a relatively straightforward use of options market data. Effective risk management strategies that incorporate this type of information represent about different sized price movements is also important in stress testing applications and in planning for exposure and price limit reactions.
Disclaimer: We request all readers, electronic media and others follow our citation guidelines when re-posting articles from farmdoc daily. Guidelines are available here. The farmdoc daily website falls under University of Illinois copyright and intellectual property rights. For a detailed statement, please see the University of Illinois Copyright Information and Policies here.


