Hot Summer Weather and 2011 Corn and Soybean Yields
In the post on July 19 we examined trend-adjusted corn yields in Illinois in the 5 previous years since 1975 when the average July temperature and precipitation most resembled that of 2011 (average temperature above 77 degrees and below-average precipitation). The state average corn yields varied considerably in those 5 years, reflecting highly diverse weather conditions in August, but averaged well below trend. Barring extremely favorable weather conditions in August 2011, the analysis pointed to a state average corn yield in 2011 in the low- to mid-150 bushel range, 13 to 15 bushels below trend value.
Here we extend the previous analysis to Illinois soybean yields and also examine the trend-adjusted U.S. average corn and soybean yields in those same 5 years. The July and August weather data for Illinois for those 5 years, along with the trend-adjusted Illinois and U.S. average corn and soybean yields are presented in Table 1. Preliminary state average temperature and precipitation data for Illinois in July 2011 are also presented. That data indicate that July 2011 was tied with 1983 as the warmest since 1975, with average temperature 3.8 degrees above the 1975-2010 average. Precipitation was below the average for the 1975-2010 period, but exceeded our expectation of July 19 due to late-month heavy rainfall in the northern part of the state.

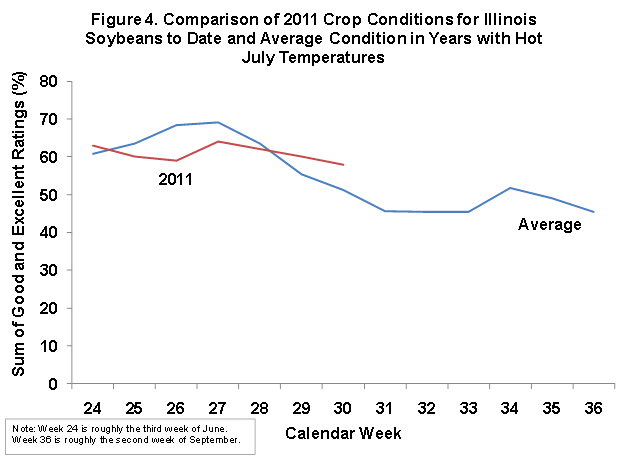
Figures 1 and 2 show the percentage of the Illinois corn and soybean crops rated good or excellent in the USDA’s Crop Progress report from the third week of June through the second week of September for each of the analog years. Except for 1977, when a cool, wet August was experienced, condition ratings generally declined sharply through the summer. Figure 3 and 4 show the average weekly crop condition ratings for the 5 analog years along with the ratings to date for 2011. The pattern of ratings for both corn and soybeans so far in 2011 is generally following the average pattern of the 5 analog years.


Trend adjusted Illinois corn yields in the analog years ranged from 132.2 bushels to 169.6 bushels and averaged 153.7 bushels, 15 bushels below the trend yield for 2011. Higher yields in 1977 and 1999 likely reflected cool and/or wet conditions in August, while lower yields in 1980, 1983, and 2002 likely reflected hot and/or dry conditions in August. Trend adjusted U.S corn yields in the analog years ranged from 135.5 bushels to 157.1 bushels and averaged 149.5 bushels, 8.5 bushels below the trend value for 2011. Note also that the correlation between Illinois and U.S. trend-adjusted corn yield in the 5 analog years was very high (correlation coefficient=0.97).
Trend adjusted Illinois soybean yields in the analog years ranged from 40.8 bushels to 51.8 bushels and averaged 46.4 bushels, 1.6 bushels below the trend value for 2011. Like corn, higher yields were experienced in 1977 and 1999 and lower yield occurred in the other three years. Trend adjusted U.S. average yields in the same 5 years ranged from 38.9 bushels to 46 bushels and averaged 41.9 bushels, 1.6 bushels below trend. Again, the correlation between Illinois and U.S. trend-adjusted soybean yield in the 5 analog years was very high (correlation coefficient=0.96).
What about 2011? The analysis of analog years suggest that both Illinois and U.S. corn and soybean yields in 2011 will be below trend value due to unfavorable July weather, with the final magnitude of the shortfall to be influenced by August weather. Current expectations are that August temperatures will be above the 1975-2010 average. Precipitation is more difficult to forecast, but below average precipitation seems more likely than above average precipitation. Under those conditions, a U.S. average corn yield in the 150 to 154 bushel range and a U.S. average soybean yield in the 41 to 43 bushel range might be expected. The extremely high temperatures in July and widespread reports of corn pollination issues suggest that corn yields may be at more risk than indicated by the historical analysis.
Disclaimer: We request all readers, electronic media and others follow our citation guidelines when re-posting articles from farmdoc daily. Guidelines are available here. The farmdoc daily website falls under University of Illinois copyright and intellectual property rights. For a detailed statement, please see the University of Illinois Copyright Information and Policies here.


