


Incomes More Sensitive to Price Declines on Cash Rent Farms
Grain farms with a higher percentage of their acres cash rented will have much lower incomes when commodity prices decline than farms with lower percentages cash rented. This is illustrated for a 1,200 cash grain farm under four different price scenarios.
The farm used in income projections is a 1,200 acre grain farm that is further described in a November 17, 2011 farmdoc daily entry here. This farm has expected yields of 187 bushels of corn and 54 bushels of soybeans, grows corn on two-thirds of acres, has non-land costs of $546 per acre for corn and $306 per acre for soybeans, and has $480,000 of debt. Budgets for corn and soybeans are shown in the November 17th entry. The four price scenarios are:
- Projected 2012 prices ($5.40 for corn, $11.70 for soybeans),
- Long-run prices ($4.50 for corn, $10.50 for soybeans),
- Low price year ($3.50 for corn, $8.20 for soybeans), and
- Poor price year ($3.00 for corn, $7.00 for soybeans).
Incomes are generated for a typical farm with 10 percent of acres owned, 30 percent share rented, and 60 percent cash rented ($275 per acre cash rent). The typical farm is compared to a farm that cash rents 100 percent of its acres for two cash rent levels: $275 per acre and $350 per acre.
Table 1 shows net incomes given that Revenue Protection (RP) crop insurance policies are purchased at 80 percent coverage levels. This crop insurance scenario represents 2012, given that crop insurance projected prices are near $5.80 per bushel for corn and $12 per bushel for soybeans. In this case, crop insurance will make payments when revenues fall, thereby reducing income falls in the face of price declines. For the “typical” farm, the 2012 projected prices of $5.40 per bushel for corn and $11.70 per bushel for soybeans results in $222,100 of net farm income. A 100 percent cash rent farm with a $275 per acre cash rent has projected net farm income of $200,500. Raising cash rent to $350 per acre reduces net farm income to $110,500.

Long-run prices of $4.50 per bushel for corn and $10.50 per bushel for soybeans represent estimates of the average price over the next five years. Prices will vary from these long-run averages, but when all prices are averaged over time, the average will be close to the long-run prices. At long-run prices, the typical farm has $86,500 net farm income. The cash rent farms have significantly lower incomes of $40,900 for the 100 percent cash rent farm with $275 per bushel cash rent and -$49,100 for a $350 per bushel cash rent. For the typical farm, net income fall $35,600 from the projected 2012 prices to the long-run prices. For the same price change, net income fell $159,600 for the cash rent farms.
Lower prices result in lower net farm incomes. For low prices ($3.50 for corn, $8.20 for soybeans) and poor prices ($3.00 for corn, $7.00 for soybeans), net incomes are $34,100 to $33,700 for the typical farm, -$20,700 to -$21,100 for the 100% cash rent farm with $275 per acre cash rent, and -$110,700 to -$111,100 for the 100% cash rent farm with $350 per acre cash rent. Net incomes do not vary much between the low and poor price scenarios because crop insurance payments are offsetting crop revenue declines as commodity prices decline.
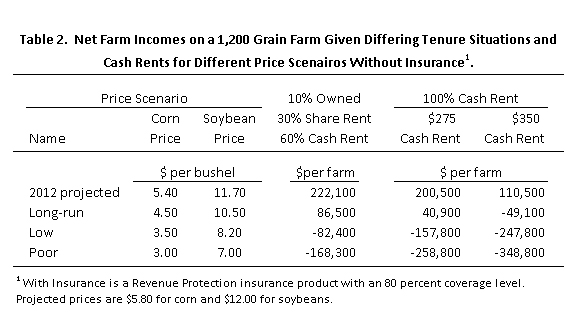
Net incomes also are projected without crop insurance. Without crop insurance represents the case where crop insurance prices have adjusted downward before projected prices are set in February, resulting in crop insurance not protecting against price declines. Without crop insurance, net incomes will be much lower at the low and poor price scenarios. At the low price scenario ($3.50 corn, $8.20 soybeans), results in -$82,400 net income for the typical farm, -$157,800 for the 100% cash rent farm with $275 per acre cash rent, and -$247,800 for the 100% cash rent with $350 per acre cash rent (see Table 2). All farms would face negative incomes. The cash rent farms would have serious deterioration of the financial position.
Summary
Projected 2012 prices of $5.40 per bushel for corn and $11.70 per bushel for soybeans results in above average incomes and most farms would have good financial incomes. Price reductions to long-run averages result in lower incomes, particularly for farms with high percentages of cash rent. At high cash rents, farms with 100% of their farm cash rented would have negative incomes. Lower prices would result in further reductions in net incomes.
When lower commodity prices occur, farms with high amounts of cash rents will face difficult decisions. Attempts may be made to lower cash rents so large financial losses do not occur. Alternatively, these farms will have to absorb financial losses under the hope that commodity prices turn upward quickly so that the farm moves into a positive income situation.
Disclaimer: We request all readers, electronic media and others follow our citation guidelines when re-posting articles from farmdoc daily. Guidelines are available here. The farmdoc daily website falls under University of Illinois copyright and intellectual property rights. For a detailed statement, please see the University of Illinois Copyright Information and Policies here.