


Reductions in Projected 2012 Crop Returns due to Projected Prices Reductions
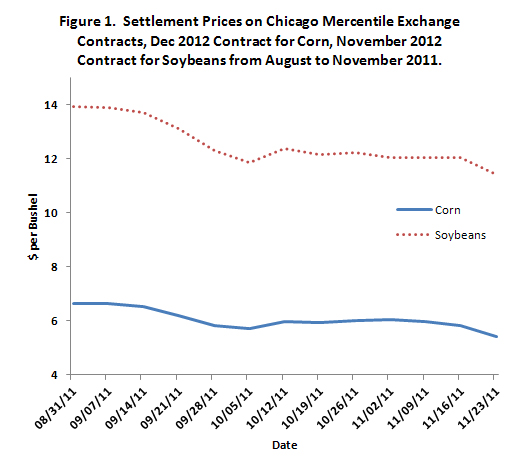
Futures prices for 2012 harvest contracts have fallen throughout the fall of 2011. For corn, the average of Wednesday settlement prices of the December 2012 Chicago Mercantile Exchange (CME) futures contract price during November is $5.40 per bushel, down by $.89 over the average of September prices of $6.29 per bushel (see Figure 1). For soybeans, the average Wednesday settlement prices of November 2012 CME contract is $11.30 per bushel in November, a decline of $1.95 over the average of September settlement price of $13.25 per bushel.
These futures prices reductions suggest that the projected prices for 2012 cash crop prices have fallen. Subtracting about a $.30 per bushel basis and rounding gives estimates of cash prices at harvest-time in 2012. The September futures contract averages suggest cash prices of $6.00 per bushel for corn ($6.29 futures price average minus basis) and $13.00 per bushel for soybeans ($13.25 futures price average minus basis). November prices suggest projected prices of $5.00 per bushel for corn ($5.40 futures price minus basis) and $11.00 per bushel for soybeans ($11.30 futures price minus basis). From September to November, expected corn price has fallen by $1.00 per bushel ($6.00 in September – $5.00 in November) and soybean price has fallen by $2.00 per bushel ($13 in September – $11 in November).
Prices changes impact expected return levels for crops, as well as the relative corn and soybean returns. These impacts are examined by calculating operator and farmland returns for two different sets of price: September projected prices of $6.00 per bushel for corn and $13.00 per bushel for soybeans and November projected prices of $5.00 per bushel for corn and $11.00 per bushel for soybeans. Yields, other revenue, and non-land costs for calculating returns are taken from 2012 Illinois Crop Budgets available in the management section of farmdoc (see Panel A of Table 1). Table 1 shows projected returns for four regions: Northern Illinois, Central Illinois with high-productivity farmland (Central-High), Central Illinois with low-productivity farmland (Central-Low), and Southern Illinois. In the discussion that follows, focus is given to the central-low region.

At September projected prices ($6.00 corn and $13.00 soybeans), the operator and farmland return for corn is projected at $608 per acre in the Central-Low region (Panel B of Table 1). For November price ($5.00 corn and $11 for soybeans), operator and farmland returns are lower and are at $426 per acre (see Panel C of Table 1). From September to November, corn returns have fallen by $182 per acre. Soybean returns are lowered by $108 per acre from $439 per acre using September prices to $339 per acre using November prices. Overall, changes in projected prices reduce returns $182 per acre for corn and $108 per acres for soybean. Given a corn-soybean rotation that is split 50 percent between each crop, returns have declined an average of $145 per acre.
While price declines have reduced expected returns, November prices still result in returns above historical averages. For a 50-50 corn and soybean rotation, the average operator and farmland return in 2012 is projected at $379 per acre (average of $426 for corn and $331 for soybeans). From 2000 to 2010, the average operator and farmland return for a 50-50 rotation has averaged $230 per acre. Except for farms with high cash rents, November prices still suggest a profitable year.
Projected price changes impact corn more than soybeans. Using September prices, corn is projected $169 per acre more profitable than soybeans ($608 corn return – $439 soybean return). November prices result in corn being $95 per acre more profitable than soybeans ($426 corn return – $331 soybean return). Price changes reduce return incentives to plant more corn. In other words, price changes have favored soybean production.
In summary, futures price changes between September and November suggest:
- Expected returns from corn and soybean product have fallen by about $145 per acre for a 50-50 rotation
- The difference in corn and soybean profits has narrowed. This narrowing of returns reduces incentives to plant more corn. If more corn acres are needed, relative prices between corn and soybeans likely will need to adjust.
Commodity prices obviously are volatile. It is likely that futures prices will change over the next several months, resulting in changed implications from those given above. Perhaps the most critical time period will be during the month of February, when futures prices are used to set projected prices for crop insurance. Once these crop insurance prices are known, much more will be known about the downside risk farmers face for the 2012 crop.
Disclaimer: We request all readers, electronic media and others follow our citation guidelines when re-posting articles from farmdoc daily. Guidelines are available here. The farmdoc daily website falls under University of Illinois copyright and intellectual property rights. For a detailed statement, please see the University of Illinois Copyright Information and Policies here.