


Sustainability of Large Payments by ACRE
Introduction
The ACRE farm program is based on three foundations:
- The only acceptable rationale for a farm safety net from the perspective of economics is to provide assistance for systemic farm risk because systemic risk results in the failure of private insurance markets.
- Assistance should be temporary to encourage the farm sector to be economically efficient and to minimize the long-term burden on taxpayers; it should slow but not stop adjustments to major structural changes.
- The program’s benchmark targets should be denominated in revenue instead of price because revenue is a more encompassing measure of farm risk.
Like any risk management program, ACRE can make large payments if a widespread, large systemic risk occurs that affects many farmers at once. However, because ACRE’s revenue benchmark can decline by up to 10% per year, it is unlikely that ACRE will make large payments for extended periods. This article examines the ACRE adjustment process over time.
Analytical Parameters
ACRE revenue payments are estimated for states with acre and yield data for the 1972 through 2005 crops of barley, corn, upland cotton, oats, peanuts, all rice, grain sorghum, soybeans, and wheat. This period had relatively stable prices, but also contained the farm financial crisis of the 1980s and Asian financial crisis of the late 1990s. The analysis assumes all acres of a crop are enrolled in the ACRE program. The analysis does not incorporate ACRE’s (1) dryland-irrigated provision, (2) farm loss provision, and (3) payment limit. These analytical parameters imply that the analysis will most likely overstate payments by ACRE. Last, yield per planted acre is used for all crops except oats. Harvested yield is used for oats.
Findings
ACRE made payments in 27.5% of the 5,858 observations involving unique crop-state-year combinations (see Figure 1 below). Thus, across the crops, states, and years included in the study, there was approximately a 25% chance that ACRE made a payment.
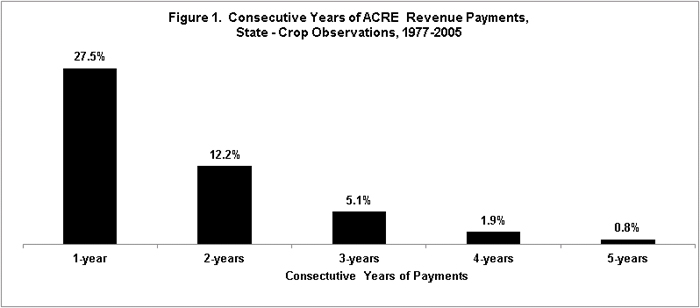
ACRE made consecutive payments in back-to-back years in only 12.2% of all 2-year observations for a crop-state combination. The occurrence of consecutive-payments continued to decline as the length of the consecutive year period increased (see Figure 1). For example, payments were made for four consecutive years in only 1.9% of all 4-year observations for a crop-state combination.
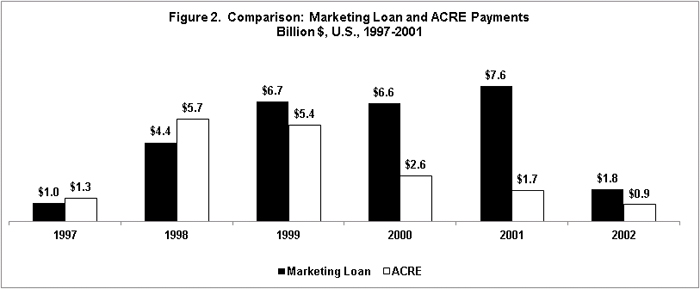
To further assess multiple-year payments, Figure 2 presents the ACRE payments estimated for the 9 crops over the 1997 through 2001 crop years. This period contains the Asian financial crisis and was the period of largest ACRE payments. To illustrate the impact of this crisis, price declined by 44 percent for corn (1995-1999), 40 percent for soybeans (1996-2001), and 45 percent for wheat (1995-1999). ACRE payments were largest for the 1998 crop at $5.7 billion, then declined to $5.4, $2.6, and $1.7 billion for the 1999, 2000, and 2001 crops, respectively. As a point of comparison, actual payments by the marketing loan program are presented. Marketing loan payments increased from $4.4 billion in 1998 to $7.5 billion in 2001. In short, the time paths of marketing loan and ACRE payments differed markedly, with the largest ACRE payments occurring early during the crisis and the largest marketing loan payments occurring well after the start of the crisis.
Implications
Like any risk management program, ACRE can make large payments. Given current revenue levels and a large decline in revenue, ACRE payments could exceed $10 billion in a year (see article by Zulauf and Orden noted below). However, unlike the marketing loan rate and counter-cyclical target price, ACRE’s benchmark values adjust downward as market revenue declines. While the decline is capped at no more than 10% per year, the decline will accumulate over time. This downward adjustment limits the period over which ACRE will make large payments, both in terms of the number of consecutive years of payments and relative to the length of large payments historically made by farm programs. Thus, ACRE results in less long term trade distortion than historically has been the case with the traditional U.S. price support programs.
This feature of ACRE also means that, when a major long-term decline in revenue occurs, U.S. farmers will need to use ACRE payments as a bridging mechanism to adjust to a world of lower revenue. Thus, farmers should see ACRE as a temporary risk management option. ACRE extends the window for adjustments beyond one year but does not provide a floor that precludes the need for adjustment as has often been the case with traditional farm programs.
This paper is also available at http://aede.osu.edu/sustainability-large-payments-acre
References
For further discussion of the payment path, program cost, and World Trade Organization (WTO) implications of ACRE, see:
Carl Zulauf and David Orden. "The Revenue Program Option in the 2008 U.S. Farm Bill: Evaluating Performance Characteristics of the ACRE Program." Agricultural and Resource Economics Review. Volume 39, Issue 3, October 2010, pages 517-533.
Note: If the ACRE program started in 1996, ACRE payments would have totaled $2.1, $6.2, $5.7, $2.6, $1.8, and $1.0 billion by year from 1997 through 2002.
Sources for the Figures: ACRE revenue payments are original calculations using data from the U.S. Department of Agriculture (USDA), National Agricultural Statistics Service accessed on November 10, 2011 t here. Marketing loan payments are from the USDA, Farm Service Agency accessed on November 14, 2011 at here. Marketing loan payments include loan deficiency payments, marketing loan write offs, and certificate gains.
Disclaimer: We request all readers, electronic media and others follow our citation guidelines when re-posting articles from farmdoc daily. Guidelines are available here. The farmdoc daily website falls under University of Illinois copyright and intellectual property rights. For a detailed statement, please see the University of Illinois Copyright Information and Policies here.