


Corn-Soybean Planting Decisions and Longer Run Returns
In many areas of central Illinois, corn-after-corn yields were substantially below corn-after-soybean yields in 2010 and 2011. These yield drags, along with large increases in corn costs, have led some farmers to reevaluate corn-soybean cropping decisions. For land productivities that predominate in Illinois, corn-after-corn and continuous corn usually have higher budgeted returns than soybeans. However, more intense corn rotations reduce corn-after-soybeans acres, often some of the most profitable acres on a farm. Reduction in corn-after-soybean acres will impact returns in future years. This article examines the longer-run return impacts of corn-soybean rotations.
Corn-Soybean Budgets
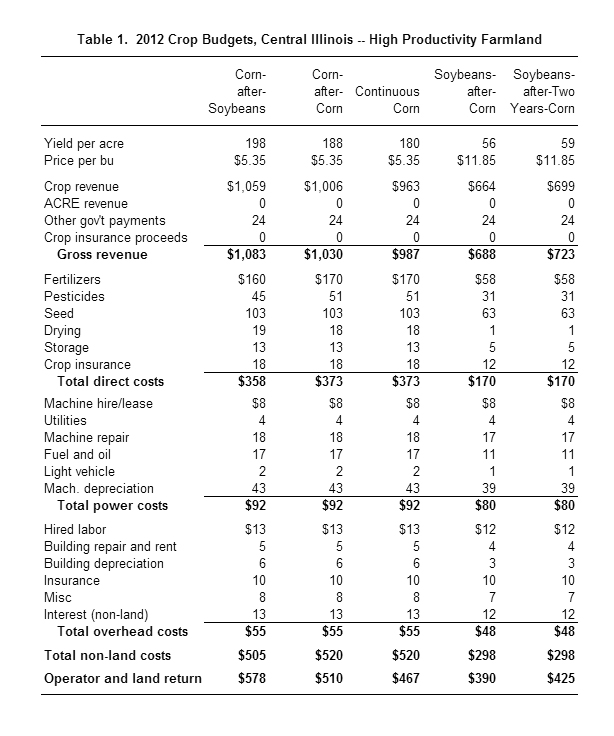
Budgets for central Illinois are shown in Table 1 for high-productivity farmland. Budgets are given for corn-after-soybean, corn-after-corn, continuous corn, soybeans-after-corn, and soybeans-after-two-years-corn.
Yields differ for the different budgets. Corn-after-soybean yield is 198 bushels. Compared to corn-after-soybeans, corn-after-corn is 10 bushels less at 188 bushels per acre and continuous corn is 18 bushels less at 180 bushels per acre. Soybeans-after-corn has a 56 bushel per acre yield. Soybeans-after-two-years of corn have 3 bushels higher yield at 59 bushels per acre. Differences in yields in these budgets reflect research conducted at the University of Illinois. Emerson Nafziger reported some of the corn yield research in a 2012 Corn & Soybean Classic Proceedings entitled “Fixing What Ails Continuous Corn” (Department of Crop Sciences, University of Illinois).
Non-land costs for corn-after-soybeans are $505 per acre. Non-land costs for corn-after-corn and continuous corn are $15 per acre higher at $520 per acre, reflecting higher fertilizer and pesticide use. Costs in Table 1 do not include more tillage for corn-after-corn and continuous corn. If more tillage is used, costs would increase by $12 to $15 per tillage pass.
Operator and land returns are:
- $578 for corn-after-soybeans,
- $510 for corn-after-corn,
- $467 for continuous corn,
- $390 for soybeans-after-corn, and
- $425 for soybeans-after-two-years-corn.
Note that all corn budgets have higher returns than soybean budgets. For the coming year, budgets suggest that returns are maximized by planting all corn.
Rotation Returns
Longer run implications of current year cropping decisions can be analyzed by calculating rotation returns given stable rotations. Rotation returns for three rotations are calculated:
- Corn-soybeans. This rotation has 50% of its acres in corn and 50% in soybeans. The rotation is one year corn and the next year soybeans. Given a stable cropping rotation over time, corn-soybeans has an average return of $484 per acre, the average of $578 for corn-after-soybeans and $390 for soybeans after corn (i.e., ($578 + $390) / 2).
- Corn-corn-soybeans. This rotation has 2/3 of its acres in corn and 1/3 in soybeans. The rotation is corn in a field for two years, followed by a year of soybeans. Given a stable cropping rotation, corn-corn-soybeans has an average return of $504 per acre (i.e., ($578 corn-after-soybeans + $510 corn-after-corn + $425 soybeans-after-corn) / 3).
- Continuous corn. Continuous corn has a return of $467 per acre. This assumes that yield reductions relative to corn-after-soybeans have occurred and corn averages 180 bushels per acre over time.
For these three rotations, rotation returns are:
- $484 for corn-soybeans
- $504 for corn-corn-soybeans, and
- $467 for continuous corn.
The highest yielding rotation is corn-corn-soybeans. Again, these rotations assume stability in plantings. Moving away from these rotations towards more corn can increase expected returns for one year. This is illustrated for two situations: 1) corn-corn-soybeans to continuous corn and 2) continuous corn to corn-corn-soybeans
Corn-Corn-Soybeans to Continuous Corn
Given the budgets in Table 1, this switch will increase returns in the first year but decrease returns in later years.
First year: Returns will increase in the first year as soybean acres are replaced with more corn. In the first year, the return will be $518 per acre, which equals the average of 1/3 of corn-after-soybeans returns ($578 per acre), plus of 1/3 corn-after-corn ($510 per acre), and 1/3 continuous corn returns ($467). The $518 per acre return is above the $504 return for corn-corn-soybeans.
Second year: In the second year of continuous corn, returns will decrease. One-third of the acres will be in corn-after-corn with a $510 per acre return and 2/3 will be continuous corn with a $467 per acre return, giving a return of $481 per acre for the continuous corn rotation in the second year. The $481 per acre return is below the $504 per acre return for corn-corn-soybeans.
Third year: In the third year, all land will be in continuous corn having a return and have a projected return of $467 per acre. The $467 per acre return is below the $504 return for corn-corn-soybeans.
The yearly tradeoffs then of moving from corn-corn-soybeans to continuous corn are:
- Year 1: $16 per acre higher returns ($518 for all corn – $504 for corn-corn-soybeans).
- Year 2: $23 per acre lower returns ($481 for all corn – $504 for corn-corn-soybeans).
- Year 3 and beyond: $37 per acre lower returns ($467 for all corn – $504 for corn-corn-soybeans).
Since there returns vary over time, this is a present value problem. Under current realistic discount factors, present value calculations suggest corn-corn-soybeans is the most profitable rotation over time.
Continuous Corn to Corn-Corn-Soybeans
Switching from continuous corn to corn-corn-soybeans has the exact opposite effect of switching from continuous corn to corn-corn-soybean: returns will be lowered in the first year and then increased in later years.
First-year: In the first year, 2/3 of the acres will be continuous corn and 1/3 will be soybeans-after-two-years-corn. This combination will have a return of $453 per acre, which is $14 less than continuous corn.
Second-year: During the second year, 1/3 of the acres will be continuous corn, 1/3 will be corn-after-soybeans, and 1/3 will be in soybeans-after-two-years of corn. This combination will have a return of $490 per acre, $23 higher than continuous corn.
Third-year: In this year, 1/3 of the acres will be corn-after-soybeans, 1/3 will be corn-after-corn, and 1/3 will be in soybeans-after-two-years-corn. This rotation will have a return of $504 per acre, $37 per acre higher than continuous corn.
The yearly sequence of difference in returns is:
- Year 1: -$14 lower return ($453 per acre – $467 per acre for continuous corn),
- Year 2: $23 higher return ($490 per acre – $467 per acre for continuous corn), and
- Year 3 and beyond: $37 per acre higher return ($504 per acre – $467 per acre).
Again this is a present value problem, with most discount factors indicating that the switch to corn-corn-soybeans has the higher return.
Caveats and Implications
Key to the above calculations are the assumptions concerning yield drags for corn-after-corn and continuous corn. Lower yield drags will cause the profitability of more intense rotations to increase.
The above budgets assume that there are no additional tillage passes for more corn-after-corn and continuous corn rotations. If one additional tillage pass with a cost of $15 per acre is included for corn-after-corn and continuous corn, rotation returns become:
- $484 per acre for corn-soybeans,
- $499 per acre for corn-corn-soybeans, and
- $452 per acre for continuous corn.
Reliance on more tillage to continue with corn heavy rotations will reduce the return advantages or more intensive corn rotations.
Budget above use projected 2012 commodity prices ($5.35 per bushel for corn and $11.85 for soybean). These prices likely are higher than what prices will average over the next five-years. Estimates of these long-run prices are $4.50 for corn $10.50 for soybeans. At these prices, rotation returns become:
- $362 per acre for corn-soybeans,
- $364 per acre for corn-corn-soybeans, and
- $299 per acre for continuous corn.
Actual costs vary across farms. Hence, each farm should use their own projected costs in rotation considerations.
It has been noted that cash rent arrangements that are short-term may encourage more corn production. If a farmer believes that they will only be able to rent a farm for one year, there is an incentive to plant all corn so as to maximize profits in one year.
Summary
There are longer run return implications from cropping decisions made in the current year. Soybean production, while currently having return estimates below corn, has the benefit of leading to corn-after-soybean plantings in future years. If significant yield reductions exist for corn-after-corn, the benefits of corn-after-soybeans in future years should not be overlooked.
Disclaimer: We request all readers, electronic media and others follow our citation guidelines when re-posting articles from farmdoc daily. Guidelines are available here. The farmdoc daily website falls under University of Illinois copyright and intellectual property rights. For a detailed statement, please see the University of Illinois Copyright Information and Policies here.