Group Risk Income Plan (GRIP) in 2012
Ratings changes made by the Risk Management Agency (RMA) will cause premiums for Group Risk Income Plan with the Harvest Price option (GRIP-HR) to be higher in 2012 as compared to 2011. For 90% coverage level policies, 2012 premiums will average 10% higher than 2011 premium for corn across Illinois and 11% higher for soybeans. Higher GRIP-HR premiums, along with lower COMBO product premiums (see here), suggests that farmers who have purchased GRIP in the past may wish to evaluate crop insurance decisions, as relative costs of the products have changed. The remainder of this article first describes GRIP use, and then details changes to expected yield and premium occurring to GRIP in 2012.
GRIP Use in Illinois
In 2011, 1.3 million acres of corn were insured using GRIP, representing 13% of all corn acres insured. Use of GRIP in corn in 2011 is 60% lower than in 2006, when 3.2 million acres were insured using GRIP. In 2011, 717 million acres of soybeans were insured using GRIP, representing 10% of all soybean acres insured. Soybean use in 2011 is 55% lower than in 2006 when 1.6 million acres were insured using GRIP.
Several reasons have been given for the reduction in use of GRIP including: 1) higher projected prices in recent years lead farmers desiring to protect their own farms, 2) higher volatilities in recent years increased GRIP premiums at 90% coverage levels more than farm-level products, 3) GRIP premiums have increasing increased due to changes in ratings, and 4) introduction of enterprise unit subsidies have lowered the costs of farm-level products. Decreasing use of GRIP may continue due to 2011 premium cost increases.
Expected Yields for Corn
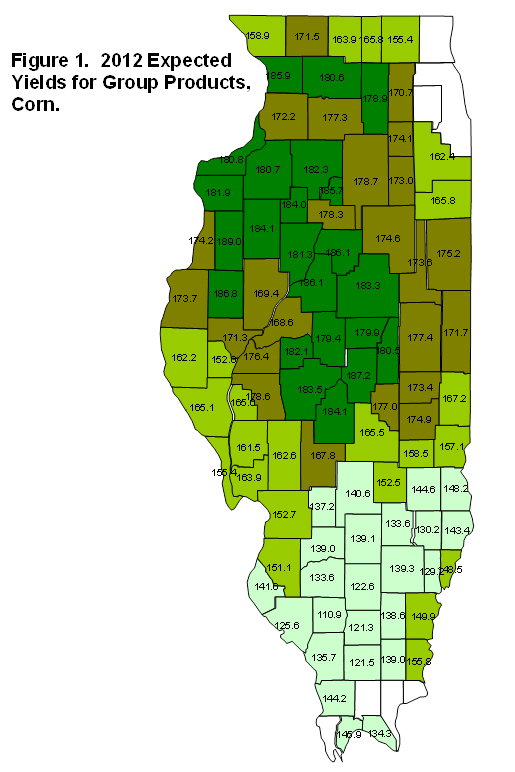
Figure 1 shows each expected yields for corn in Illinois. These expected yields are set by RMA to reflect the most likely yield in a county. Expected yields are used to set GRIP guarantees. Higher expected yields result in higher guarantees and vice versa.

Expected yields for corn follow expected yield patterns in Illinois. Higher yields occur in central and northern Illinois. The five highest expected yields occur in central Illinois counties: Warren (189.0 bushels), Macon (187.2), McDonough (186.8), Woodford (186.1) and Tazewell (186.1) Counties. Lower yields occur in southern Illinois. The five lowest expected yields occur in Perry (110.9), Franklin (121.3), Williamson (121.5), and Jefferson (122.6) Counties.
RMA changed 2012 expected yields from 2011 levels. Overall, expected yields have increased an average of .9 bushels in 2012. Not all counties have increases. Across all Illinois counties, 38 have increases in expected yields in 2012, 36 have the same yield in 2011 and 2012, and 21 have decreases in yields in 2012.
GRIP-HR Premiums for Corn
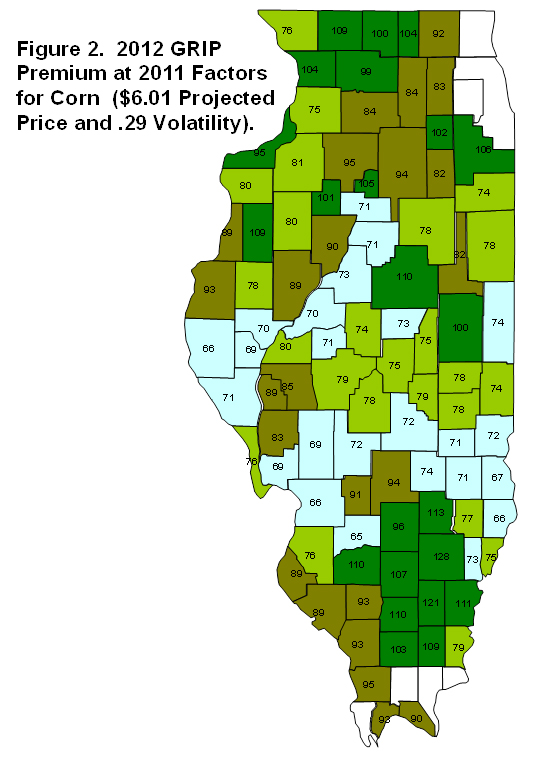
Figure 2 shows GRIP-HR corn premiums by county. Premiums are for a 90% coverage level at a 100% protection level, choices resulting in the highest GRIP-HR premiums. At a 90% coverage level, GRIP-HR premiums can be reduced by lowering the protection level. The lowest protection level is 60%, which results in premiums that are 60% of those shown in Figure 1. A 60% protection level choice also reduces payments to 60% of the 100% protection level.

Premiums in Figure 1 are shown for a $6.01 projected price and a .29 volatility, values at 2011 levels. Computing 2012 premiums using 2011 projected price and volatilities allows comparison of premium changes from 2011 to 2012 that are caused by adjustments to rates. Changes reflect an assessment of the risks, with premium increases indicating an assessment that risks are higher. Actual 2012 premiums will vary from those shown in Figure 1 because the projected price and volatility will vary from those used in generating premiums in Figure 1.
GRIP-HR premiums range considerably over Illinois. Two counties have premiums over $120 per acre: Wayne ($127) and Hamilton ($121). Five counties have premiums at $110 and $120 per acre: Clay ($112), Franklin ($110), McLean ($110), Washington ($110), and White ($112). At the low end, eight counties had premiums below $70 per acre: Adams ($66), Brown ($69), Clinton ($65), Crawford ($67), Jersey ($69), Lawrence ($66), Macoupin ($69), and Madison ($66) Counties.
On average, GRIP-HR premiums at the 90% coverage level in 2012 are 10% higher than 2011 premiums. Only two counties have premium reductions from 2011 levels: Green (-3%) and Grundy (-1%). The largest increases occurred in Madison (16%) and Richland (15%) counties.
Some of the premium increases are due to higher expected yields. However, even counties with the same or lower expected yields have higher premium. For example, the 36 counties that have the same in expected yields in 2011 and 2012 have an average increase in premiums of 9%. The 21 counties with lower expected yields have a 7% premium increase.
Expected Yields for Soybeans
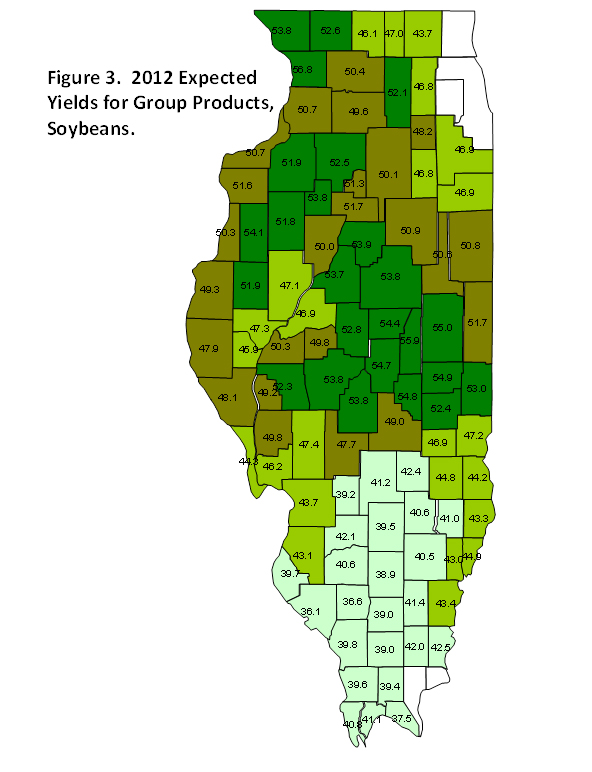
Figure 3 shows expected yields for soybean. Similar to corn, the highest expected yields are in northern and central Illinois. The five highest expected yields occur in Carroll (56.8 bushels), Piatt (55.8), Champaign (54.8), Douglas (54.9), and Moultrie (54.8) Counties. The lowest yields occur in southern Illinois. The five lowest yields occur in Randolph (36.1 bushels), Perry (36.6), Massac (37.5), and Jefferson (38.9) Counties.

The 2012 expected soybean yields average .9 bushels higher than 2011 expected yields across all Illinois counties. Three counties have expected yield decreases: Grundy (-1.3 bushels), Massac (-.60 bushels), and Union (-.10 bushels). Thirteen counties have no change in expected yields while 81 have expected yield increases.
GRIP-HR Premiums for Soybeans
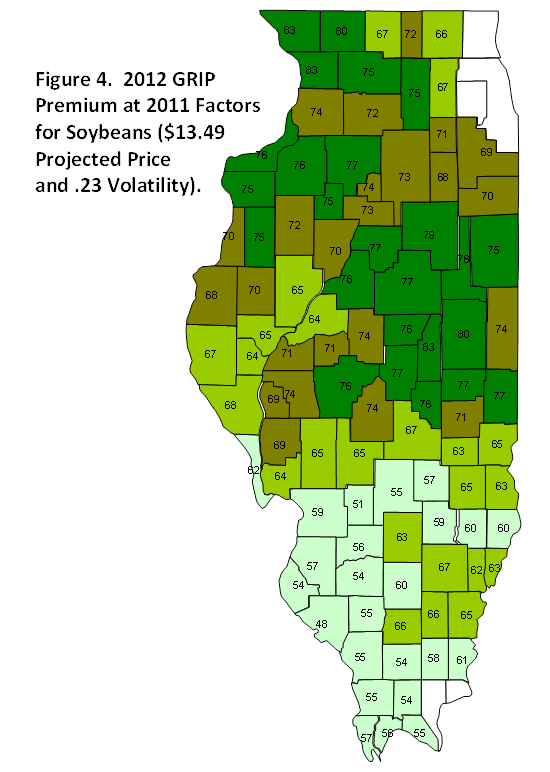
Figure 4 shows GRIP-HR premiums at a 90% coverage level and 100% protection level. Premiums range across counties. Five counties have premiums $80 per acre of over: Piatt ($83 per acre), Jo Daviess ($83), Carroll ($83), Champaign ($80), and Stephenson ($80). The six counties with the lowest premiums are Randolph ($48 per acre), Bond ($51), Johnson ($54), Washington ($54), Williamson ($54), and Monroe ($54) Counties.

At 2011 projected price and volatility levels, 2012 premiums for GRIP-HR 90% coverage levels polices average 11% higher than 2011 premiums. The highest increase of 14% occurs in ten counties: Jefferson, Winnebago, Perry, Wayne, Stephenson, Peoria, Monroe, Lee, Whiteside, and Marion Counties. The six counties with the lowest increases are Saline (3%), Henderson (4%), Edwards (5%), Fayette (5%), McDonough (5%), and Warren (5%) Counties.
Summary
Even given these premium increases, payments received from corn GRIP products averaged over time likely will exceed premiums that are paid by famers. This is possible because of risk subsidies associated with these multi-peril crop insurance products. Compassions of historical yields suggest that average payments will not exceed premiums for soybean products.
While expected payments exceed premium for corn, recent premium increases make GRIP relatively less attractive compared to the farm-level COMBO products. Moreover, COMBO product premiums have decreased, further providing an incentive to switch to COMBO products. Farmers who have purchased GRIP should evaluate whether the returns, costs, and risk reductions still favor GRIP.
Disclaimer: We request all readers, electronic media and others follow our citation guidelines when re-posting articles from farmdoc daily. Guidelines are available here. The farmdoc daily website falls under University of Illinois copyright and intellectual property rights. For a detailed statement, please see the University of Illinois Copyright Information and Policies here.


