


The Historic Pattern of U.S Soybean Yields, Any Implications for 2012?
Like the U.S. average corn yield, the U.S. average soybean yield was below trend value in 2011. Market sentiment favors a return to trend yield for soybeans in 2012. Here we examine the pattern of yields from 1960 through 2011 (Figure 1) to identify any patterns that might be helpful in forming expectations for 2012. See our earlier post for similar observations about corn yield in 2012.

That pattern results in the following observations and thoughts:
- Soybean yields have trended higher since 1960. We find that a linear trend is the best fit to actual average yields over that period and that yields have increased at a rate of 0.4 bushels per acre per year. While some have argued that soybean yield trend reached a plateau in recent years, this is not evident in the data, particularly since 2004.
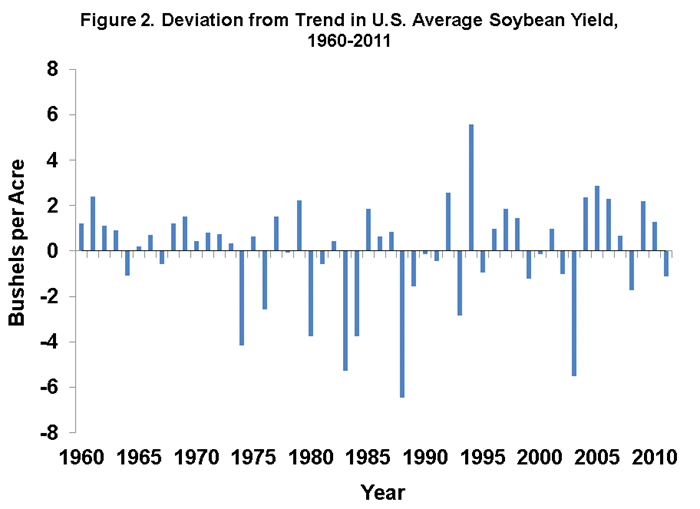
- There has been substantial deviation from the trend yield in individual years (Figure 2). Over the 52 year period, the average yield was above the trend yield in 60 percent of the years and below the trend in 40 percent of the years. Since all deviations from a linear trend must sum to zero, this means that in the 40 percent of the years with a below trend yield the deviations were on average larger than the deviations in the more frequent years when yields were above trend. Specifically, the average deviation below trend was 2.1 bushels while the average deviation above trend was 1.4 bushels. The largest deviation below trend was 6.5 bushels (1988) while the largest deviation above trend was 5.6 bushels (1994). There were four instances of the deviation below trend exceeding 4 bushels and only one instance of the deviation above trend exceeding 4 bushels. The frequency and magnitude of deviations are logical for two reasons: i) good (normal) growing season weather occurs more frequently than poor weather, and ii) good growing season weather helps soybean yields less than poor weather hurts yields due to the non-linearity of the relationship between soybean yields and precipitation. Further discussion of this topic can be found in our earlier report on crop weather modeling.
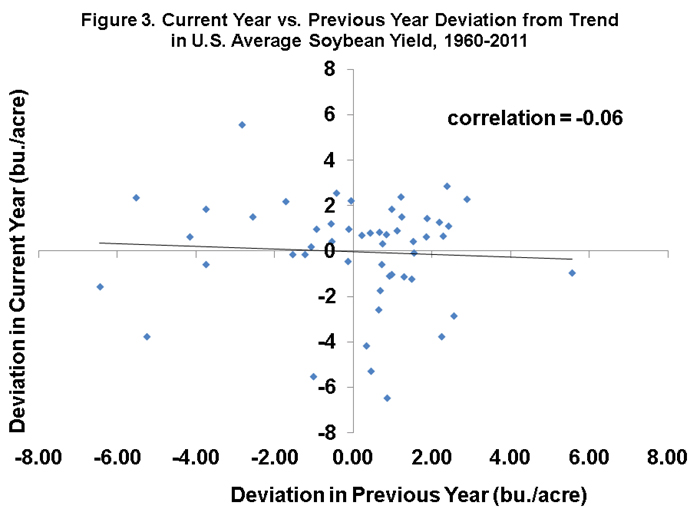
- The 60/40 split between above and below trend yields is a general statement that applies to any year in the sample. A different, but related, question is whether there is a marked correlation between deviations from year-to-year. In other words, is there a tendency towards continuation or reversal of deviations? Figure 3 shows that there is almost no correlation between the yield deviation in the previous year and the current year (correlations can vary between -1 and +1, with zero indicating no relationship).
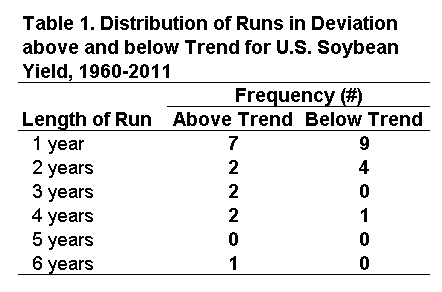
- The correlation discussed above is based on comparing deviations in pairs of adjacent years. It is also interesting to examine whether longer “runs” in the deviations occur. The distribution of runs of consecutive positive or negative yield deviations is summarized in Table 1. There were 7 single year runs with positive deviations and 9 single year runs of negative deviations. This simply means that a positive deviation was followed by a negative deviation and vice versa in these 16 years. The longest run of negative yield deviations was 4 years (1988-1991). Positive deviations had runs of 3 years (1985-1987 and 1996-1998), 4 years (1960-1963 and 2004-2007), and 6 years (1968-1973). Since positive deviations are more common than negative deviations, it is logical that more and longer runs of positive yield deviations have occurred.
- Given that the 2011 yield was below trend, of particular interest is the length of previous runs of negative deviations. There have been four instances of 2 consecutive years of negative yield deviations (1980-1981, 1983-1984, 1999-2000, and 2002-2004) and the one instance of 4 consecutive negative deviations identified above So, even though multiple-year runs of negative yield deviations have not occurred frequently they have happened and we should expect them to happen again at some point in the future.
Summary
For any particular year, including 2012, history suggests a 60 percent chance of an average U.S. soybean yield above trend and a 40 percent chance of an average yield below trend value. The odds slightly favor a soybean yield above trend in 2012, but there is precedent for another year below trend. More specific expectations about the 2012 average yield will depend on how the planting and growing season unfolds.
Disclaimer: We request all readers, electronic media and others follow our citation guidelines when re-posting articles from farmdoc daily. Guidelines are available here. The farmdoc daily website falls under University of Illinois copyright and intellectual property rights. For a detailed statement, please see the University of Illinois Copyright Information and Policies here.