


The Historic Pattern of U.S Winter Wheat Yields, Any Implications for 2012?
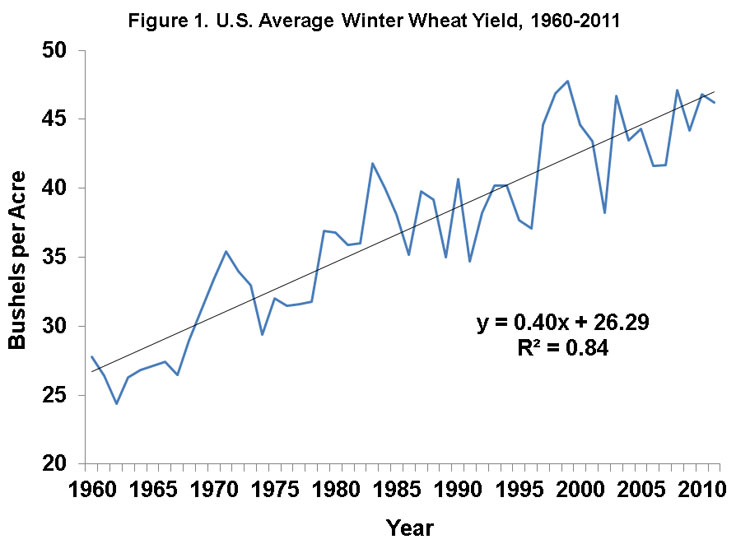
The U.S. average winter wheat yield was below trend value in 2011. Market sentiment favors a return to trend yield in 2012. Here we examine the pattern of yields from 1960 through 2011 (Figure 1) to identify any patterns that might be helpful in forming expectations for 2012. See our earlier posts for similar observations for corn and soybean yields in 2012.
That pattern results in the following observations and thoughts:
- Winter wheat yields have trended higher since 1960. We find that a linear trend is the best fit to actual average yields over that period and that yields have increased at a rate of 0.4 bushel per acre per year. There have been recent periods when it appeared that yields were plateauing, but these periods have not persisted.
- There has been substantial deviation from the trend yield in individual years (Figure 2). Over the 52 year period, the average yield was above the trend yield in 48 percent of the years and below the trend in 52 percent of the years. Since all deviations from a linear trend must sum to zero, this means that in the 48 percent of the years with an above trend yield the deviations were on average slightly larger than the deviations in the more frequent years when yields were below trend. Specifically, the average deviation above trend was 2.3 bushels while the average deviation below trend was 2.1 bushels. The largest deviation above trend was 6 bushels (1983) while the largest deviation below trend was 5.2 bushels (2002). There were four instances of the deviation above trend exceeding 4 bushels and only two instance of the deviation below trend exceeding 4 bushels. The pattern and magnitude of yield deviations has been very different than that for corn and soybeans where negative yield deviations have been less frequent and larger in size (on average) than positive yield deviations.

- The 48/52 split between above and below trend yields is a general statement that applies to any year in the sample. A different, but related, question is whether there is a marked correlation between deviations from year-to-year. In other words, is there a tendency towards continuation or reversal of deviations? Figure 3 shows that there is a modest positive correlation (.31) between the yield deviation in the previous year and the current year (correlations can vary between -1 and +1, with zero indicating no relationship). That is, there is a modest tendency for the yield deviation in one year to persist in the following year. It is not clear if this is simply a chance result or if it reflects some form of carryover in growing conditions from year-to-year.

- The correlation discussed above is based on comparing deviations in pairs of adjacent years. It is also interesting to examine whether longer “runs” in the deviations occur. The distribution of runs of consecutive positive or negative yield deviations is summarized in Table 1. There were 6 single year runs with positive deviations and 5 single year runs of negative deviations. This simply means that a positive deviation was followed by a negative deviation and vice versa in these 11 years. The longest run of negative yield deviations was 8 years (1961-1968), but there were also runs of 5 years (1974-1978) and 4 years (2004-2007). Positive deviations had runs of 7 years (1979-1985) and 5 years (1969-1973 and 1997-2001). Since negative deviations and positive deviations occur with almost the same frequency, it is logical that the number and length of runs of negative and positive yield deviations would be similar.

- Given that the 2011 yield was below trend, of particular interest is the length of previous runs of negative deviations. There have been five previous instances of single year negative deviations from trend yield and five instances of 2 or more consecutive years of negative deviations from trend yield. Given that multiple-year runs of negative yield deviations have occurred relatively frequently in the past, we should expect them to happen again at some point in the future
Summary
We estimate the trend yield for U.S. winter wheat in 2012 to be 47.5 bushels per acre based on data from 1960-2011. For any particular year, including 2012, history suggests a 48 percent chance of an average U.S. winter wheat yield above trend and a 52 percent chance of an average yield below trend value. The odds slightly favor a winter wheat yield below trend in 2012. More specific expectations about the 2012 average yield will unfold as the crop comes out of dormancy and spring weather prospects emerge. The USDA will release the first yield forecast on May 10th.
Disclaimer: We request all readers, electronic media and others follow our citation guidelines when re-posting articles from farmdoc daily. Guidelines are available here. The farmdoc daily website falls under University of Illinois copyright and intellectual property rights. For a detailed statement, please see the University of Illinois Copyright Information and Policies here.