


Simple versus Olympic Averages in Prices used in Farm Commodity Programs
When historical averages are needed, an Olympic average often is used rather than a simple average in calculating benchmarks in Farm Bill commodity programs. For example, the Agricultural Risk Coverage (ARC) program that was passed by the Senate Agriculture Committee uses Olympic averages of prices and yields in calculating benchmark revenue. In this post, Olympic averages are compared to simple averages for corn and soybean prices. Generally, Olympic and simple averages will track one over time. The relationship of Olympic to simple averages depends on the nature of distributions across time.
Olympic averages eliminate the high and low observations and then average all remaining observations. The simple average uses all observations when it takes its average. The nature of outliers will determine whether the Olympic average is above or below the simple average. When all observations are in a narrow range except for one outlier that is below the remaining observations, the Olympic average will be above the simple average. This occurs because the Olympic average will eliminate the low outlier. On the other hand, when observations are in a narrow range and one observation is above the remaining observations, the Olympic average will be below the simple average. More complicated differences in outliers will result in unpredictable relationships between the Olympic and simple average.
Olympic and simple averages are shown for corn and soybean prices. The averages are based on the five previous years of data since ARC uses 5-year averages in calculating its benchmarks.
Corn Prices
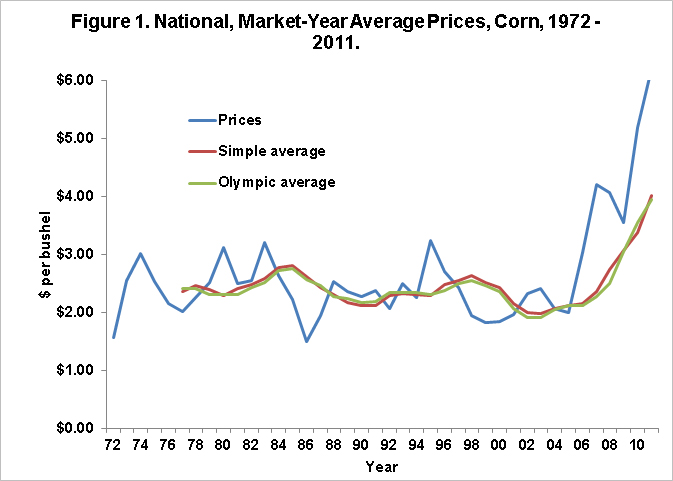
National, market-year average prices are shown in Figure 1 for corn from 1972 through 2011. Also shown is the Olympic Average Price (green line) and simple average price (red line). The graph does not suggest there are large differences in the Olympic and simple averages. From 1977 through 2011, the Olympic average price averaged $2.43 per bushel and the simple average price averaged $2.46 per bushel. Note that there are approximately as many prices below the averages as above the averages, suggesting that there will not be a consistent relationship between the Olympic and average averages.
A more clear view of the differences between these averages is shown in Figure 2, which gives the Olympic average price minus the simple average price. The Olympic and simple averages usually are within $.10 of one another. Several periods to note:
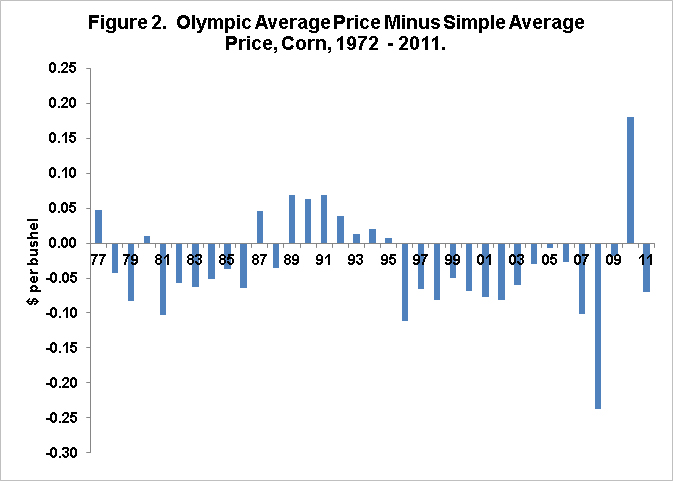
- The Olympic average was $.11 below the simple average in 1995. This occurred because the 1995 price of $3.24 was much higher than 1991 through 1994 prices. The 1991-1994 prices were all below $2.50 per bushel. The 1995 price was the high resulting in it being thrown out of the 1995 Olympic average. This caused the Olympic average to be below the simple average.
- The 2008 Olympic average was $.25 below the simple average. The 2007 price was $4.02, the first of the higher prices occurring between 2007 through 2011. The $4.02 was not included in the Olympic average, but was included in the simple average.
- The 2010 Olympic average price was $.18 per bushel above the simple average. This difference occurred because the 2006 through 20o9 prices were in a range betwe $3.03 and $4.20 per bushel. The 2005 price was $2.00 per bushel, which was not included in the Olympic average.
Soybeans Prices
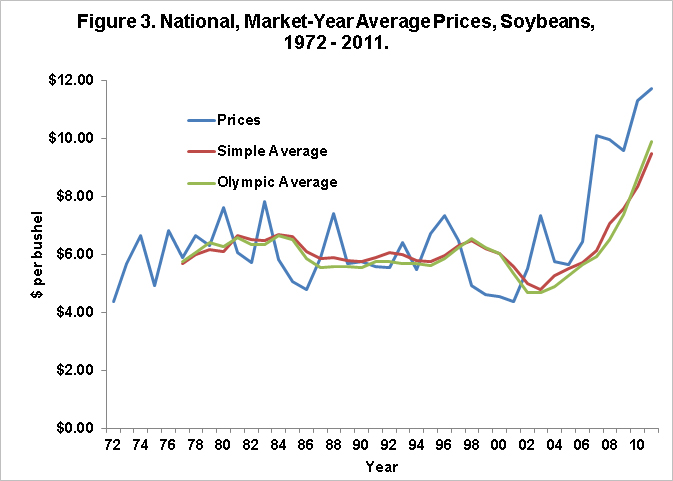
Soybean prices, along with Olympic and simple averages, are shown in Table 3. From 1980 through 2005, most of the outliers were above the average. This suggests that the Olympic average will be below the simple average in most years. As can be seen in Figure 4, the Olympic average for soybean prices is below the simple average most of the time.
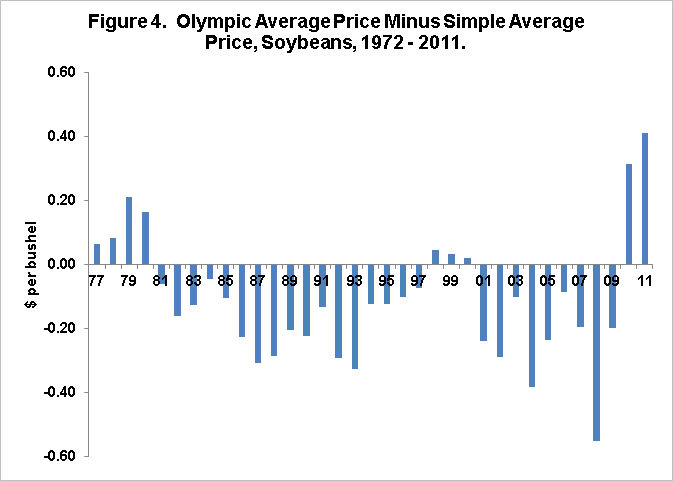
Note that the 2010 and 2011 Olympic averages were above the simple averages. The string of prices contributing to these averages is $5.66 in 2005, $6.43 in 2006, $10.10 in 2007, $9.97 in 2008, and $9.96 in 2009, $9.59 in 2009, and $11.30 in 2011. The 2010 averages will use the 2005 through 2009 price, with the 2005 price of $5.66 being below the remaining prices. The Olympic average price eliminates this low price, giving a 2010 Olympic average above the 2010 simple average. In 2011, the $6.42 price from 2006 is much lwer than the 2007 through 2010 prices. Tis low 2011 price is eliminated in the Olympic average, again resulting in the Olympic average being above the simple average.
Summary
Olympic averages will differ from simple averages. For prices, it is difficult to know the relationship between Olympic and simple averages.
Disclaimer: We request all readers, electronic media and others follow our citation guidelines when re-posting articles from farmdoc daily. Guidelines are available here. The farmdoc daily website falls under University of Illinois copyright and intellectual property rights. For a detailed statement, please see the University of Illinois Copyright Information and Policies here.