


Recent Observations on the Tolerance of Corn Yield to Drought Conditions
The tolerance of U.S. corn yields to hot and dry, or drought, conditions is a topic of perennial interest. There has been a great deal of discussion in recent years whether current corn varieties have greater drought tolerance than in the past. We have discussed this issue in a previous post and publication. Here, we highlight three recent observations that provide further pieces of this puzzle.
The first observation is the 2011 yield of irrigated corn in Texas. As shown in Figure 1, irrigated corn yields in Texas tend to deviate by relatively small amounts from the long-term trend, typically only +/- 10 bushels per acre. This makes sense since irrigation removes the main limitation to dryland corn yields–summer precipitation. From this perspective the decline in irrigated corn yields in 2011 is nothing short of astonishing. The actual yield of 133.9 bushels was the lowest since 1983 and represented a 33% drop below trend (based on a trend regression estimated over 1981-2010). The drop was due to the extreme drought conditions in Texas last year, which were so severe that many irrigations systems simply did not have the capacity to keep up with the water demand of the corn plants. This is a dramatic demonstration that modern corn hybrids are still susceptible to very hot and dry conditions.
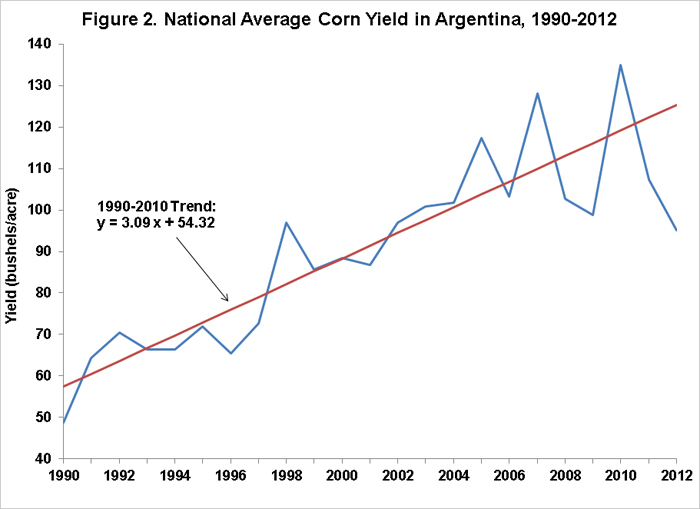
The second observation is the 2012 yield of corn in Argentina. Since this yield series represents dryland production, the deviations from trend can sometimes be quite large. The 2012 estimated yield of 95.1 bushels is a case point. This yield was 24 percent below trend (based on a trend regression estimated over 1990-2010). One can argue that this drop is even more relevant to the debate regarding drought tolerance since Argentine corn production practices are comparable to those in the U.S. and the hot and dry weather conditions in 2011-12 that occurred in Argentina were not as historically extreme as those that occurred in Texas last year.

The first two observations establish the not too surprising result that corn yield remains susceptible to drought conditions, but yields still may have been better than if the same conditions occurred, say, 20 years ago. One needs to somehow normalize yield outcomes by weather conditions over time and then see if yields now are better than in the past under similar conditions. This leads to our third set of observations. Working with a recent James Scholar here at the University of Illinois, Alyssa Falk, we estimated crop weather models similar to those found here for each of the nine Illinois crop reporting districts (CRDs) over 1960-2011. These models include a time trend, temperature, and precipitation variables. Errors were computed as the difference between actual yield in a given year and the yield predicted by the model.
In the next step, we searched for years and CRDs between 2000 and 2011 with hot or dry summer weather conditions. The time period is limited to these years in order to isolate recent improvements in drought tolerance, if any. We defined a hot summer as a year between 2000 and 2011 when average July-August temperatures were more than one standard deviation above normal and a dry summer as a year when July precipitation was one standard deviation below normal. We then collected the crop weather model errors for the years and CRDs that met either criterion.
Figure 3 presents the model errors (actual minus predicted yields) for hot or dry summers over 2000-2011. Note that each observation represents the model error for a particular year and CRD, with 2002, 2003, 2007, 2010, and 2011 having at least one CRD that meets the criterion for hot or dry summers. We are looking for a pattern in the sign and magnitude of the model errors in these particular years. Specifically, negative errors indicate over-estimation of yield and positive errors under-estimation. One can clearly see a pattern of the model errors since 2007 becoming more positive during hot or dry summers. The average magnitude of the positive errors in Figure 3 since 2007 is 4.4 bushels, or roughly three percent of trend yield. If one restricts the sample to dry years only since 2007 the average of the model errors increases to 9.9 bushels, but this is based on only three observations. Despite the relatively small sample of hot or dry observations, this analysis provides evidence that corn yields in the U.S. Corn Belt are now slightly, perhaps even moderately, more drought tolerant than in the past. We note this is consistent with a more comprehensive recent research study on drought tolerance of U.S. corn yields.

Summary
The drought tolerance of U.S. corn yield is always a topic of interest and it is especially important in a year like this when a relatively low level of stocks is projected for the start of the marketing year. The take home message from this analysis is two-fold: 1) U.S. corn yields are likely somewhat less susceptible to drought conditions than in the past; and 2) a Corn Belt-wide drought would still lead to sizable yield reductions relative to trend.
Disclaimer: We request all readers, electronic media and others follow our citation guidelines when re-posting articles from farmdoc daily. Guidelines are available here. The farmdoc daily website falls under University of Illinois copyright and intellectual property rights. For a detailed statement, please see the University of Illinois Copyright Information and Policies here.