Kazakhstan, Russia, Ukraine (KRU) and World Grain Markets
Overview
A major change in world grain markets over the last quarter century is the increasing role of Kazakhstan, the Russian Federation, and Ukraine (KRU). This change is examined in this article.
Analysis
Production and trade of wheat as well as barley, corn, oats, rye, sorghum, and wheat as a group are examined. Wheat is an important animal feed, especially outside the U.S.; hence the need to examine wheat as part of the broader grains market. The data used in this discussion are from the Food and Agriculture Organization (FAO). Data for the individual countries formed by the breakup of the former Soviet Union begin with 1992 in the FAO data set.
Share of World Exports
KRU’s share of world wheat exports has increased from an average of 4% during 1992-1996 to 18% during 2006-2010 (see Figure 1). The corresponding increase in KRU’s average share of world grain exports was from 3% to 12%. In comparison for the same periods, the U.S. average share of world wheat exports declined from 31% to 20% while the U.S. average share of world grain exports declined from 41% to 31%. While KRU’s share of world exports has increased since the early 1990s, it is worth noting that 2002 marked a decidedly large and, so far, sustained increase in KRU’s role in the world wheat and grain trade.

Production of grain in KRU is only 6% higher in 2006-2010 than in 1992-1996 (see Figure 2). This increase in production accounts for only 29% of KRU’s increase in grain exports over this period. Instead, KRU’s increasing grain exports largely reflects its smaller use of grain. Of specific note, production of beef, chicken and pork in KRU has declined by 15% since the early 1990s.
 <
<
Annual production of wheat and grain varies notably more in KRU than in either the U.S. or South America; other large geographical areas that are grain exporters (see Figure 3). The standard deviation of the annual percent changes in production of wheat and grains has exceeded 25% in KRU since the early 1990s. In contrast, over the same period, average annual percent variability of grain production in the U.S. and South America is 16% and 11%, respectively. The higher level of variability in KRU reflects an agro-climate that is more subject to weather-related stress, such as drought and winter kill due to low temperatures.

Price Variability
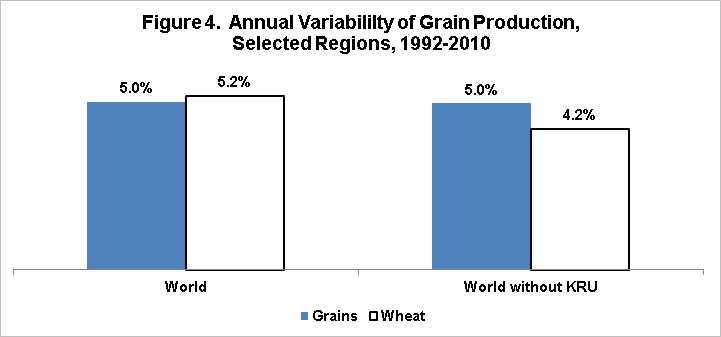
The higher production variability in an increasingly important source of world trade raises the issue of its impact on the variability of price. This requires a complex analysis, but to provide initial insight, a simple analysis is conducted. Specifically, the standard deviation of percent change in the crop year average price for U.S. corn and wheat are calculated. The calculations are for the periods before and after 2002, or the year in which KRU’s share of world grain trade first reached double digits. Price variability is greater after 2002 than before 2002, although the increase is only 2 percentage points in magnitude. While many factors are at play, including the rapid increase in the use of corn for ethanol; this simple analysis suggests that the emergence of KRU as a major grain exporter may lead to higher price volatility in the grain and wheat markets.

Observations and Implications
- Kazakhstan, Russia, and Ukraine have emerged as major players in world grain markets.
- They likely have substituted for the U.S. in world wheat and grain markets.
- Even though the emergence of KRU predates the current era of farm prosperity, it is possible that this emergence could parallel the importance of the emergence of South America, namely Brazil, as a result of the farm prosperity of the 1970s.
- While no definitive conclusion can be reached, it is possible that price variability will be higher in the future than in the past. To the extent this consequence is realized, risk management and by extension the farm safety net will be even more important in the future.
- Last, it is important for the U.S. wheat industry to think through the consequences of what a growing role for KRU means for the future of the U.S. wheat industry. KRU appears to be a formidable competitor that may potentially continue to take away U.S. market share in wheat.
SOURCE for Figures 1-3: Original calculations using data from Food and Agricultural Organization (FAO) of United Nations, FAOSTAT – Crop Production Database, accessed 10/2012.
SOURCE for Figure 4: Original calculations using data from U.S. Department of Agriculture, National Agricultural Statistics Service, Quick Stats, accessed 10/2012
This publication is also available at http://aede.osu.edu/publications.
Disclaimer: We request all readers, electronic media and others follow our citation guidelines when re-posting articles from farmdoc daily. Guidelines are available here. The farmdoc daily website falls under University of Illinois copyright and intellectual property rights. For a detailed statement, please see the University of Illinois Copyright Information and Policies here.


