


2013 Illinois County Yields and GRIP Payments
The National Agricultural Statistical Service (NASS) recently released county yields for corn and soybeans for 2012. These yields confirm that the drought significantly lowered 2012 production, with extremely low yields being prevalent in southern Illinois. Corn yields were more impacted than soybean yields. With county yield estimates, Group Risk Income Plan with the harvest price option (GRIP-HR) can be estimated. Most counties will have GRIP-HR payments for corn, with many counties having large payments. Fewer counties had GRIP-HR payments for soybeans.
Illinois Corn Yields
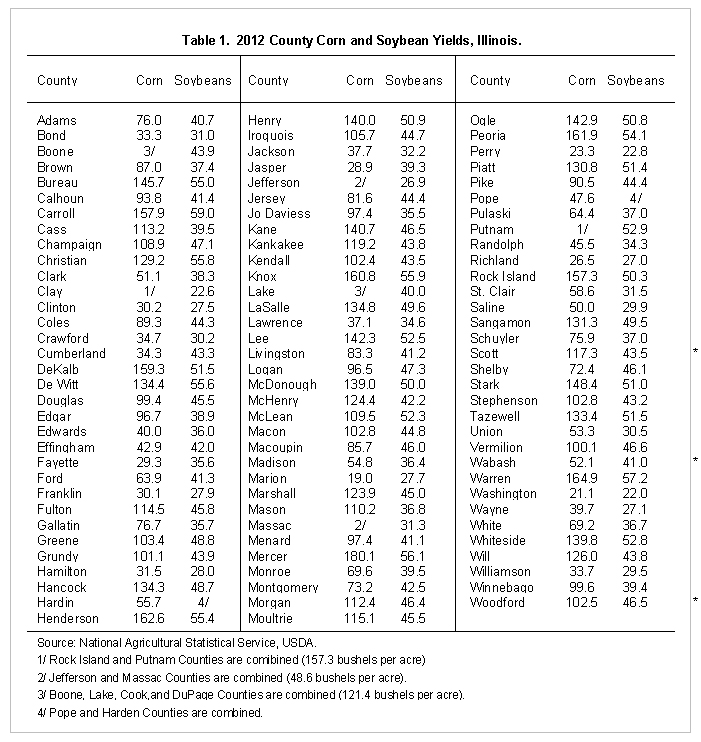
Illinois corn yields were extremely low, with some of the lowest corn yields in southern Illinois (see Figure 1 as well as Appendix Table 1 for yields). The county with the lowest corn yield was Marion County, having a yield of 19 bushels per acre. There were five counties with corn yields in the 20 bushel range, all of which are located in southern Illinois: Washington (21 bushel per acre, Perry (23 bushels), Richland (27 bushels), Jasper (29 bushels), and Fayette (29) counties. Obviously, the 2012 drought had a devastating impact on yields in southern Illinois.
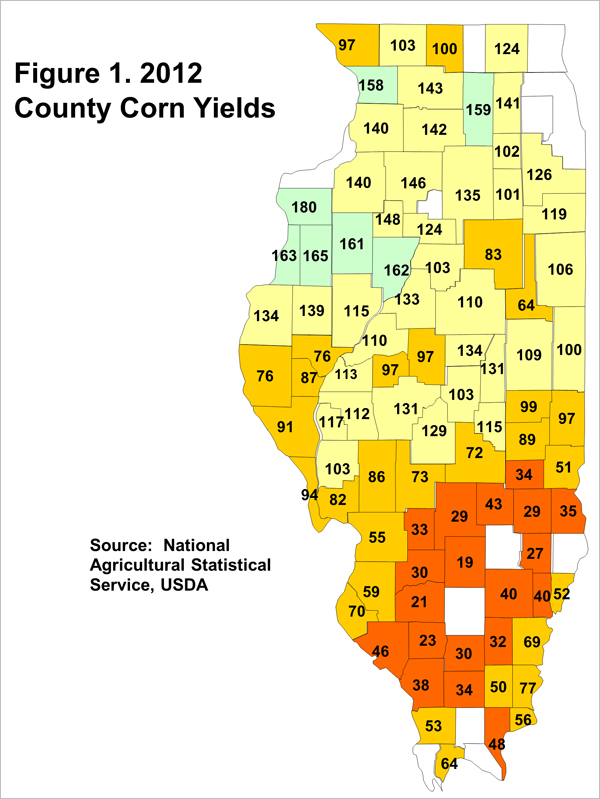
Central Illinois also had low yields, with three areas particularly hard hit. In western Illinois, near the Mississippi River, there were several counties with below 90 bushel yields: Adams (76 bushels), Schuyler (76 bushels), and Brown (87 bushels) Counties. Logan and Menard Counties in mid-central Illinois had yields of 97 bushels per acre. In east-central Illinois, Ford County had a 64 bushel yield and Livingston County had an 83 bushel yield.
The highest corn yields generally were in western Illinois, centered around Mercer County. Mercer County had a 180 bushel per acre yield.
Illinois Soybean Yields
While not exceptional, Illinois soybean yields were not as poor as Illinois corn yields (see Figure 2). There were many counties in northern and central Illinois that averaged over 50 bushels per acre. Most counties in southern Illinois had yields above 25 bushels per acre. Carroll County in northwest Illinois had the highest soybean yield of 59 bushels per acre. Washington County in southern Illinois had the lowest county yield of 22 bushels per acre.
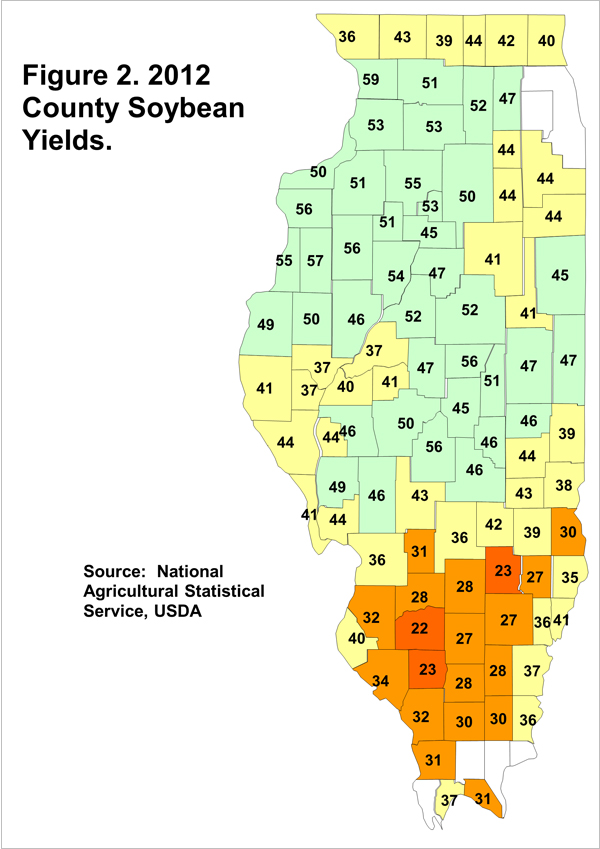
There were six counties that had average soybean yields that higher than average county corn yields, an unusual occurrence. All these counties were located in southern Illinois and included Cumberland (43 bushel soybean yield versus 34 bushel corn yield), Fayette (35 bushel soybean yield versus 39 bushel corn yield), Jasper (39 bushel soybean yield versus 29 bushel corn yield), Marion (28 bushel soybean yield versus 19 bushel corn yield), Richland (27 bushel soybean yield versus 26.5 bushel corn yield), and Washington Counties (22 bushel soybean yield versus 21 bushel corn yield).
GRIP-HR Payments for Corn
Group Risk Income Plan with the Harvest Revenue IGRIP-HR) is the most used county level insurance product, with most individuals taking the policy at the 90% coverage level. With the release of county yield data, reasonable estimates of GRIP-HR estimates can be made. Figure 3 shows GRIP-HR estimates at the 90% coverage level and the 100% protection level. The 100% protection level is the highest protection level. Farmers can choose a lower protection level. If farmers choose a 60% protection level, the lowest protection level, the payments would be 60% of those shown in Figure 3.
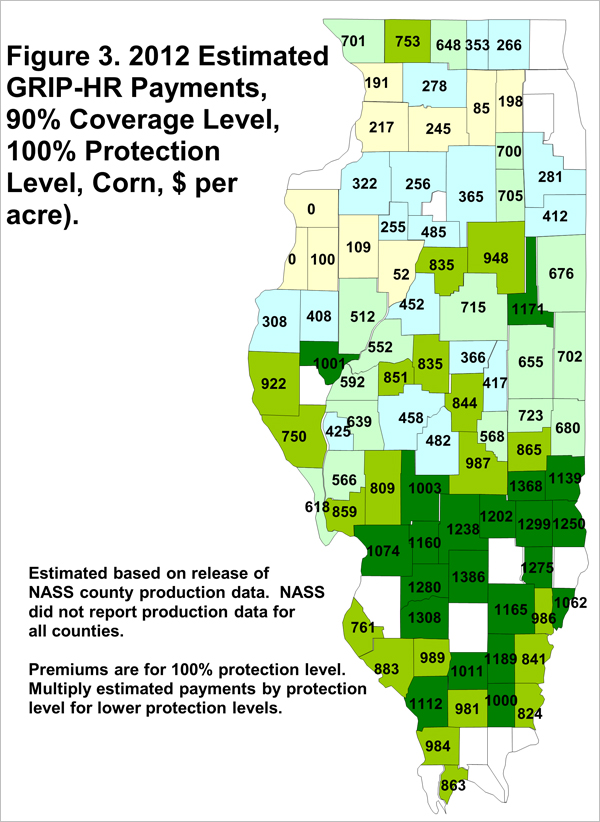
Many counties in southern Illinois, and several counties in central Illinois, have estimated payments over $1000 per acre. This would be an expected outcome in a drought year for a product with the harvest price increase. Lower yield trigger payments that are then paid at the higher harvest price.
Note that there are several counties that have blanks in Figure 3. There were a number of counties that have GRIP policies for which NASS did not report county production data: Boone, Clay, Lawrence, Jefferson, Rock Island, Massac Counties. It remains to be seen how RMA will determine GRIP-HR payments in these counties.
GRIP-HR Payments for soybeans
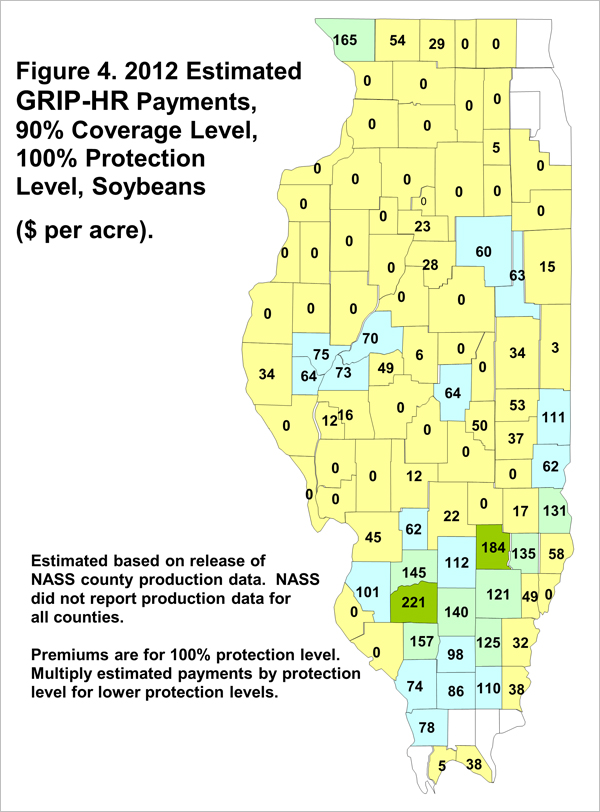
Fewer counties had GRIP-HR payments (see Figure 4). For those counties having payments, GRIP-HR payments were lower than for corn. These lower payments reflect the fact that soybean yields were less impacted by the drought compared to corn yields.
Summary
Corn yields were low over much of Illinois, with the lowest yields occurring in southern Illinois. As a result of low yields, GRIP-HR will make payments in most Illinois counties. Soybeans yields were not as low as corn yields. Fewer counties will have GRIP-HR payments.
Appendices
Disclaimer: We request all readers, electronic media and others follow our citation guidelines when re-posting articles from farmdoc daily. Guidelines are available here. The farmdoc daily website falls under University of Illinois copyright and intellectual property rights. For a detailed statement, please see the University of Illinois Copyright Information and Policies here.