Know Your Term Debt and Capital Lease Coverage Ratio
From your accounting records, you’ve likely prepared (or had prepared) your financial documents for 2012. Those financial statements tell the story of your successes and challenges for 2012. As one of a series of measures that help tell that financial story of your farm operation, lets’ consider the Term Debt and Capital Lease Coverage Ratio in today’s post.
The Term Debt and Capital Lease Coverage Ratio measures your ability to cover or pay your term debt and capital lease payments prior to the purchase of any other assets. The greater this ratio (over 1:1), the greater your ability to cover those obligations.
The calculation of the Term Debt and Capital Lease Coverage Ratio looks like this:
Net Farm Income From Operations
Plus: Total Non-Farm Income
Plus: Depreciation
Plus: Interest on Term Debt and Capital Leases
Less: Income Tax Paid
Less: Family Living Expense
Divided By: Annual Scheduled Principal and Interest Payments on Term Debt and Capital Leases
As this ratio increases, your ability to cover your debt and capital lease payments increases as well. A ratio of 1:1 indicates your ability to meet your term debt and capital lease obligations. A ratio in excess of 1:1 indicates a margin available to deal with a short term cash flow difficulties and the presence of cash to take advantage of alternative opportunities. A ratio of less than 1:1 indicates the inability to pay term debt obligations.

Since this is a ratio, we can compare it across farms to gain some understanding of how the ratio varies.
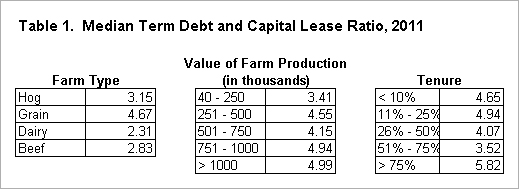
When considering farm type (see Table 1 above), one can see that grain farms have a higher ratio (4.67) than do the livestock farms. For 2011, this difference is likely due to higher grain prices which are an advantage for the grain farmer and a disadvantage for the livestock feeder. Among the livestock farms, hog farms have a higher median ratio (3.15) than do beef (2.83) or dairy (2.31).
When considering the size of the farm for comparison, lets’ use farm revenue as our measure. Farms with a Value of Farm Production of $40,000 to $250,000 have median ratio of 3.41. The four groups with Value of Farm Production over $250,000 all had a ratio above 4.00 with the two larger groups near a ratio of 5.00.
When analyzing your farm it is important to consider the profitability of your operation and it is also important to consider your ability repay debt. Both play a vital role in the financial management of your farm. The amount of cash that can be generated by your business can be influenced by your decisions that are designed to generate cash but do not necessarily reflect the profitability of the farm such as refinancing existing debt or selling capital assets. Refinancing existing debt or selling capital assets can help in generating cash to satisfy debt payments, but your business must be profitable in the long run to survive.
The authors would like to acknowledge that data used in this study comes from the local Farm Business Farm Management (FBFM) Associations across the State of Illinois. Without their cooperation, information as comprehensive and accurate as this would not be available for educational purposes. FBFM, which consists of 5,700 plus farmers and 60 professional field staff, is a not-for-profit organization available to all farm operators in Illinois. FBFM staff provide counsel along with recordkeeping, farm financial management, business entity planning and income tax management. For more information, please contact the State FBFM Office located at the University of Illinois Department of Agricultural and Consumer Economics at 217.333.5511 or visit the FBFM website at www.fbfm.org.
Disclaimer: We request all readers, electronic media and others follow our citation guidelines when re-posting articles from farmdoc daily. Guidelines are available here. The farmdoc daily website falls under University of Illinois copyright and intellectual property rights. For a detailed statement, please see the University of Illinois Copyright Information and Policies here.


