


2013 Net Incomes for Grain Farms Likely Below Levels in Recent Years
At the time of this writing, the critical periods for determining corn and soybeans yields are near. Unlike last year, weather conditions do not appear to be adversely impacting yields and near normal yields could occur. Futures contracts prices are now suggesting prices for fall delivery near $5 per bushel for corn and $12 per bushel for soybeans. Given these prices and near normal yields, 2013 net incomes would be below those of recent years. This is illustrated by simulating 2013 farm incomes.
Farm Situation
Net farm income is simulated for the following farm designed to be representative of commercial grain farms in Illinois:
- The farm has 1,200 acres.
- Expected yields are 187 bushels per acre for corn and 54 bushels per acre for soybeans, with two-thirds of acres in corn and one-third in soybeans.
- The farm owns 120 acres, share-rents 360 acres, and cash rents 720 acres. This represents the typical tenure/rental situation for farms in northern and central Illinois.
- Cash rent is $300 per acre.
- Farm costs are specified at levels contained in 2013 crop budgets.
- The farm has $480,000 of debt.
Projected 2013 Net Farm Incomes
Net farm incomes are projected for different yield-price scenarios. The first has yields slightly above average: 195 bushels per acre for corn and 58 bushels for soybeans. These yields are used under the presumption that weather conditions will be normal during the upcoming critical yield-determination periods. Prices are near current cash bids for fall delivery: $4.80 for corn and $12.00 for soybeans. This will result in $146,000 of net farm income (See Table 1).
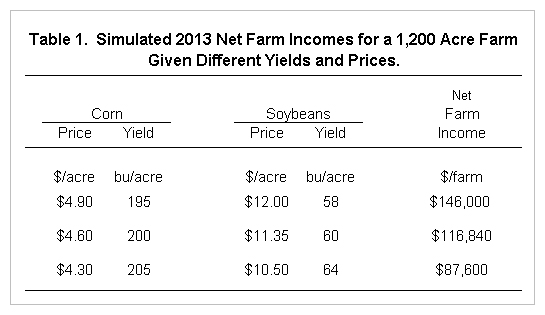
To evaluate sensitivity of incomes to prices, net incomes are projected for two lower price scenarios. Prices are lowered to $4.60 per bushel for corn and $11.35 per bushel for soybeans. While lower than current forward contract prices, these prices have a reasonable chance of occurring. Yields are increased to account for a usual positive relationship between yields and prices: 200 bushels per acre of corn and 50 bushels per acre for soybeans. Net farm income under these prices and yields is $116,840.
The final scenario has a price of $4.30 per bushel for corn and $10.50 per bushel for soybeans. This represents a substantial drop in prices over recent levels. Yields are increased to 205 bushels per acre for corn and 64 bushels per acre for soybeans. This scenario results in $87,600 of net farm income.
Projected Incomes Compared to Recent Historical Incomes
Between 2007 and 2011, average net incomes on grain farms in Illinois have exceeded $200,000 in all years but 2009. Even though 2012 was a drought year with low yields, net incomes in 2012 were in the high $200,000s because of high commodity prices and because crop insurance covered yields shortfall.
Projected 2013 incomes are below recent incomes. A couple of reasons exist for lower 2013 net incomes. First, commodity prices are projected at lower levels than in recent years. For example, the $4.90 corn price used to simulate 2013 incomes compares to average farmer received prices of $5.34 in 2010, $6.24 in 2011, and $6.80 in 2012. Second, costs have increased dramatically in recent years. The combination of lower commodity prices and higher costs leads to lower projected incomes.
Summary
Near average yields and commodity prices at current harvest bid levels will result in lower net incomes compared to average incomes in recent years. Of course, these are early projections and yields and prices could differ from those used in the above projections. Income projections will be more certain once more is known about 2013 yields. Hence, actual incomes could vary substantially from those projected here.
Lower net incomes are not necessarily suggestive of financial pressures. More likely, incomes in recent years were high because a variety of factors led to relatively high corn and soybean prices. Projection contained herein may represent more usual income levels than incomes in recent years.
Disclaimer: We request all readers, electronic media and others follow our citation guidelines when re-posting articles from farmdoc daily. Guidelines are available here. The farmdoc daily website falls under University of Illinois copyright and intellectual property rights. For a detailed statement, please see the University of Illinois Copyright Information and Policies here.