Farm and Family Living Income and Expenses for 2012
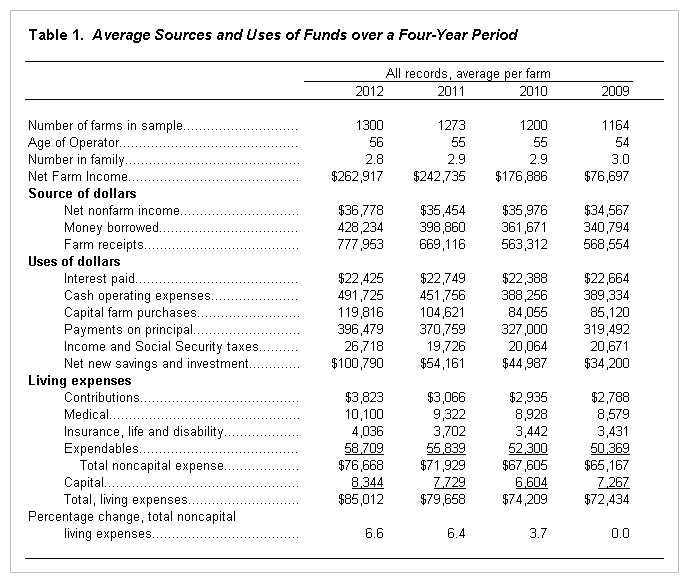
In 2012, the total noncapital living expenses of 1,300 farm families enrolled in the Illinois Farm Business Farm Management Association (FBFM) averaged $76,668 – or $6,389 a month for each family (Table 1). This average was 6.6 percent higher than in 2011. Another $8,344 was used to buy capital items such as the personal share of the family automobile, furniture, and household equipment. Thus, the grand total for living expenses averaged $85,012 for 2012 compared with $79,658 for 2011, or a $5,354 increase per family. The average amount spent per family for capital items was $615 more while noncapital expenses increased $4,739 per family. The sample farms, which were mainly grain farms, were located primarily in central and northern Illinois.
Income and Social Security Taxes Paid
Income and social security tax payments increased about 35 percent in 2012 compared to the year before. The amount of income taxes paid in 2012 averaged $26,718 compared to $19,726 in 2011. Medical expenses were higher in 2012 compared to 2011. In 2012, medical expenses averaged $10,100. Medical expenses include out-of-pocket costs for health insurance along with doctor and hospital expenses. Net nonfarm income continues to increase, averaging $36,778 in 2012. Net nonfarm income has increased $10,859, or 42 percent in the last ten years.

In Table 1, the averages per farm for total family living expenses are divided into five categories for 2009 through 2012. The “expendables” category includes cash spent or food, operating expenses, clothing, personal items, recreation, entertainment, education, and transportation. This category also includes selected itemized deductions such as the personal share of real estate taxes. Cash spent for capital improvements exceeding $250 is not included. Table 1 also contains averages for the high third and low third sorted by noncapital living expenses for families of three to five. The high third averaged $124,569 of noncapital family living expense while the low third averaged $50,906.

The authors would like to acknowledge that data used in this study comes from the local Farm Business Farm Management (FBFM) Associations across the State of Illinois. Without their cooperation, information as comprehensive and accurate as this would not be available for educational purposes. FBFM, which consists of 5,700 plus farmers and 60 professional field staff, is a not-for-profit organization available to all farm operators in Illinois. FBFM field staff provide on-farm counsel with computerized recordkeeping, farm financial management, business entity planning and income tax management. For more information, please contact the State FBFM Office located at the University of Illinois Department of Agricultural and Consumer Economics at 217-333-5511 or visit the FBFM website at www.fbfm.org.
More Information
A complete report “Farm and Family Living Income and Expenditures, 2009 through 2012” is available on the farmdoc website here.
Disclaimer: We request all readers, electronic media and others follow our citation guidelines when re-posting articles from farmdoc daily. Guidelines are available here. The farmdoc daily website falls under University of Illinois copyright and intellectual property rights. For a detailed statement, please see the University of Illinois Copyright Information and Policies here.


