


Corn and Soybean Returns Suggest Stable Illinois Acreages
Prospective plantings of corn and soybeans in 2014 are beginning to receive attention. In this post, corn and soybean returns for 2013 and 2014 are examined to evaluate potential acreage shifts in Illinois. While soybeans will be more profitable than corn in 2013, projections for 2014 indicate that corn will be more profitable than soybeans. These return projections suggest that profitability considerations do not lead to shifts in acres between corn and soybeans.
Relative Corn and Soybean Prices
While other factor also impact profits, a major factor impacting relative profits is relative corn and soybean prices. Relative prices often are measured as the soybean-to-corn price ratio, which equals soybean price divided corn price. Between January 1975 and September 2013, the soybean-to-corn price ratio in Illinois has averaged 2.52 (see Figure 1). Values below average indicate that prices cause corn to be relatively more profitable than soybeans, and vice versa.
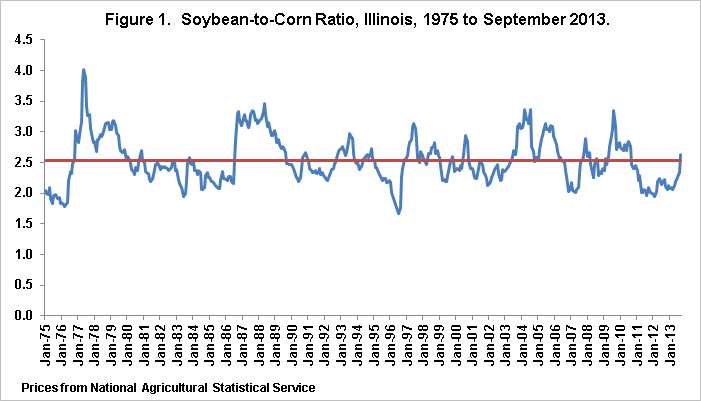
Between September 2010 and August 2013, the soybean-to-corn price ratio has been below the 2.52 average. Four months have had ratios below 2.00: 1.98 in August 2011, 1.99 in December 2011, 1.98 in January 2012, and 1.95 in February 2012. Overall, price in the three years between September 2010 and August 2012 have favored corn production.
In fall 2013, the soybean-to-corn price ratio has moved significantly above the 2.52 average. Current harvest times bids for 2013 are near $4.30 per bushel for corn and $12.80 per bushel for soybeans, giving a soybean-to-corn price ratio of 2.97 (2.98 = $12.80 soybean price / 4.30 corn price). This is a much higher ratio than in the three most recent years and is high by historical standards. Monthly soybean-to-corn price ratios have exceeded 2.98 in only 15 percent of the months between January 1975 and September 2013. The relatively high ratios in fall 2013 result in higher 2013 soybean returns relative to corn.
However, 2014 harvest-time bids do not suggest that high soybean-to-corn price ratios will persist. Current bids for grain delivered in 2014 harvest-time are near $4.50 per bushel for corn and $11.40 per bushel for soybeans, yielding a 2.53 soybean-to-corn price ratio, near the historical average.
Overall, the above prices suggest that 2013 soybean returns will be relatively higher than 2013 corn returns. Harvest-time bids in 2014 suggest a more “normal” relationship between corn and soybean returns.
Projected Corn and Soybean Returns in 2013 and 2014
Historically, corn has been more profitable than soybeans, as illustrated in Figure 2. This figure shows historical and projected corn-minus-soybean returns for grain farms in central Illinois having high-productivity farmland that are enrolled in Illinois Farm Business Farm Management (FBFM). Corn-minus-soybean returns equal corn returns minus soybean returns, with positive values indicating that corn is more profitable than soybeans.

Between 2000 and 2012, corn has been more profitable than soybean in all but two years: 2002 and 2009. Since 2006, commodity prices have reached higher levels than prior to 2006. Between 2006 and 2012, corn-minus soybean returns have averaged $92 per acre.
Since financial records for 2013 have not been summarized, corn-minus-soybean returns for 2013 are projections. In 2013, corn-minus-soybean return is projected to be -$64 per acre, indicating that soybeans will be more profitable than corn. The primary factor leading to higher soybean returns is high soybeans prices relative to corn prices, as indicated by the 2.97 soybean-to-corn price ratio. A secondary factor is relatively high nitrogen costs for corn production in 2013 caused lower corn returns relative to soybean returns.
Corn-minus-soybean return in 2014 is projected at $34 per acre. While corn is projected to be more profitable than soybeans, the corn-minus-soybean return in 2014 is projected at less than the 2006-2012 average of $92 per acre. Difference in corn and soybean returns in 2014 is projected less than in recent history.
Crop Budgets
More detail on projected returns can be seen in the crop budgets shown in Table 1. These budgets are adaptations of 2014 Illinois Crop Budgets available in the management section of farmdoc (available here). Note two items on these budgets. First, corn price is set at $4.50 per bushel and soybean price is set at $11.40 per bushel. These prices differ slightly from the 2014 Crop Budgets on farmdoc, and reflect current cash bids for 2014 harvest-time delivery.

The second is fertilizer costs. Fertilizer costs for corn-after-soybeans is projected at $135 per acre, considerably below the $200 actual value for 2012 and $170 projected value for 2013. Fertilizer prices have declined considerable from 2013 levels. Anhydrous ammonia prices currently are in the high $600 per ton range, compared to the mid to high $800 per ton range for much of the 2012-13 growing season. Lower fertilizer prices in general and nitrogen prices in particular causes corn returns to increase relative to soybean returns.
Table 1 contains budgets for corn-after-soybeans, corn-after-corn, soybeans-after-corn, and soybeans-after-two-years of corn. Budgeted returns are useful for calculating returns from rotations, which may indicate whether farms will shift acres between corn and soybeans. Two specific rotations of interest are:
- A corn-soybean rotation has 50% of its acres in corn and 50% in soybean and has an average return of $338 per acre (an average of $364 corn-after-soybean return and $311 soybean-after-corn return), and
- A corn-corn-soybeans rotation has 2/3 of its acres in corn and 1/3 in soybean and has an average return of $334 per acre (an average of $364 corn-after-soybeans return, $304 corn-after-corn return, and $334 corn-after-two-years-corn return).
The corn-soybeans and corn-corn-soybeans rotations have near identical returns: $338 for corn-soybeans and $334 corn-corn-soybeans. Most farms have acreage roughly in the percentage range implied by the above rotations. These returns do not suggest major shifts in rotations so as to obtain higher profits.
Summary
In 2014, corn is projected to be more profitable than soybeans on central Illinois farms with high-productivity farmland, differing from 2013 projections in which soybean returns exceed corn returns. While the current 2013 soybean-to-corn price ratio is high, harvest-time bids for 2014 lead to near average soybean-to-corn price ratio. Near average prices, along with lower fertilizer costs, then lead to corn being projected more profitable than soybeans in 2014. While 2014 corn-minus-soybean returns are projected positive, corn returns are projected to exceed soybean returns by less than the average corn-minus-soybean returns from 2006-2012. Overall, these return projections do not suggest large shifts in acres between corn and soybeans.
Since relative yields and costs do vary across farms, farms should evaluate profitability on their farm. Relative profits may differ from the averages shown in this post.
Disclaimer: We request all readers, electronic media and others follow our citation guidelines when re-posting articles from farmdoc daily. Guidelines are available here. The farmdoc daily website falls under University of Illinois copyright and intellectual property rights. For a detailed statement, please see the University of Illinois Copyright Information and Policies here.