


Watching Your Liquidity Levels – Preparing for 2014
As we prepare for closing out our records for 2013, we have plans in place for 2014 and know that it will likely bring us lower profit margins. Several factors are working in the farm economy to erode our working capital positions that began to build with the advent of the renewable fuels standard that was a result of the Energy Policy Act of 2005. It isn’t difficult to envision $200 less per acre in revenue in 2014. Budgets created by Gary Schnitkey for central Illinois higher productivity soils show a $548 operator and land return as recent as 2012. That same operator and land return had eroded to $409 for 2013 and is estimated at $378 for 2014. As your review your end-of-year financial statements note the trends in the amount of liquidity in your operation over the past few years as you look to keep a close watch on that liquidity in 2014.
Working Capital is the financial cushion that represents your operations ability to weather financial difficulty. It’s like a full tank of diesel in the truck without a refueling point in sight. As long as you have enough you don’t worry about it. When the fuel gauge starts to point to ‘E’ and there isn’t a truck stop in sight…you begin to worry a bit. Thus, the stronger your working capital, the longer you can experience low profitability or even losses before ‘re-fueling’ is necessary. The strong returns of the past five to seven years have done much to ‘re-fuel’ the collective liquidity tank of production agriculture.
Capital purchases have affected our working capital. The IRS Code Section 179 Expense Election and Bonus Depreciation may have assisted in lowering your tax liability for the past few years, but that may have come at the expense of decreasing your working capital. Now, would be a good time to create a capital budget for the next five years so that you get the most ‘mileage’ out of your working capital over a period where margins could be thin.
Working Capital to Value of Farm Production is a measure of the amount of funds available for use if you sold all current assets and paid all current liabilities. Working Capital to Value of Farm Production ‘marries’ the balance sheet (working capital) to the income statement (VFP) to arrive at a ratio that makes your liquidity position relative to the size of the farming operation. The higher the WC/VFP ratio, the more liquidity the farm operation has to meet obligations. WC/VFP varies by farm type, farm revenue, age of the farm operator, and tenure.
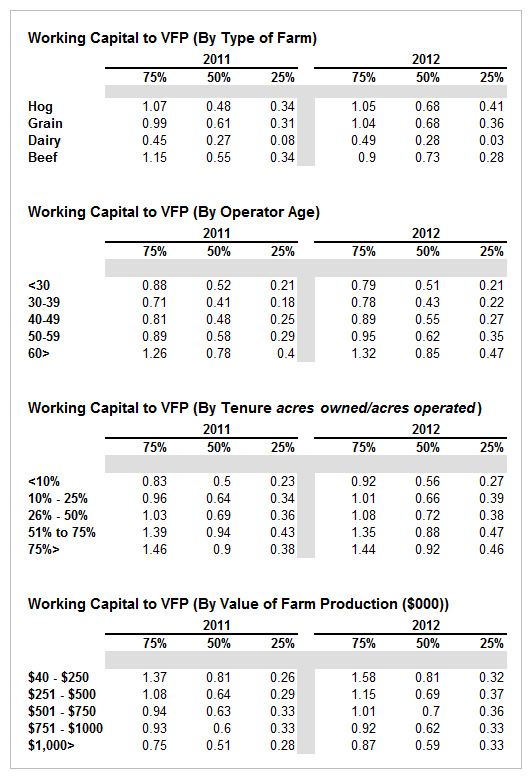
You can easily make this calculation for your own farm as you do some end-of-the-year benchmarking. Use your December 31, 2013 Balance Sheet and your Accrual Income Statement for the year ending December 31, 2013. On the Balance Sheet, find your current assets and subtract your current liabilities from the current assets. (Be sure to include the current portion of your deferred income taxes in your current liabilities.) Take that result and divide it by the value of farm production from your Accrual Income Statement. Now you have your answer! Think of WC/VFP in terms of a percentage. If your WC/VFP is 0.60, then you have 60% of the years’ revenue in a very liquid position for your operation. Among other things, this liquidity can provide cash to purchase operating inputs or make capital purchases. In 2012, the median WC/VFP was 0.68 for a group of grain farms in the Illinois FBFM database. For that same group of farms at the 75th percentile, the WC/VFP was 1.04. The value of the ratio can vary throughout the production cycle. It is typical to measure WC/VFP at the same point in the cycle (December 31) to better compare the ratio from year to year.
- WC/VFP is varies with the age of the farm operator. For those over age 30, as age increases, the WC/VFP at the median and the 75th/25th percentile increase as well. (See the ‘By Age’ table.)
- WC/VFP also tends to increase with the tenure ratio. As one owns’ a more substantial portion of the land one farms, WC/VFP increases as well at both the median and the 75th/25th percentile.
- Farm type also impacts the WC/VFP. Dairy farms tend to carry lower levels of WC/VFP and lower levels of liquidity in general.
- When compared by farm revenue (VFP), WC/VFP tends to be lower at greater levels of farm revenue especially at the median and the 75th percentile.
Larger revenue farms with lesser levels of owned land would see a potential doubling up of the signs that would point to lower levels of liquidity via the WC/VFP ratio.
Click here to find other financial benchmarks for your farm.
It’s been said before that ‘cash is king’…monitor your working capital closely and spend it wisely knowing that it may be more difficult to build working capital in the future.
The authors would like to acknowledge that data used in this study comes from the local Farm Business Farm Management (FBFM) Associations across the State of Illinois. Without their cooperation, information as comprehensive and accurate as this would not be available for educational purposes. FBFM, which consists of 5,700 plus farmers and 60 professional field staff, is a not-for-profit organization available to all farm operators in Illinois. FBFM staff provide counsel along with recordkeeping, farm financial management, business entity planning and income tax management. For more information, please contact the State FBFM Office located at the University of Illinois Department of Agricultural and Consumer Economics at 217.333.5511 or visit the FBFM website at www.fbfm.org.

Disclaimer: We request all readers, electronic media and others follow our citation guidelines when re-posting articles from farmdoc daily. Guidelines are available here. The farmdoc daily website falls under University of Illinois copyright and intellectual property rights. For a detailed statement, please see the University of Illinois Copyright Information and Policies here.