


A Closer Look at Farm Liquidity
There is more than one way to evaluate financial liquidity. Working Capital is expressed in dollars (current assets less current liabilities) and the current ratio which is a relative term (current assets divided by current liabilities). Both of these measures point to the level of liquidity that exists at a point in time and tell of amount of financial cushion available. Farming is known to be an industry where it is all too common to be ‘cash poor and asset rich’. Knowing the level of one’s cash cushion is always prudent and will be paramount as we deal with lower margin levels. Lenders typically use one or more of these liquidity measures when assessing the financial position of a potential borrower.
Perpetuating the idea that you’ve seen here before that ‘Cash is King’, lets’ explore the liquidity measure Working Capital to Value of Farm Production (WC/VFP). We looked at this using 2011 data and in a limited fashion. We will do explore a bit deeper with 2012 data.
Working Capital to Value of Farm Production is a measure of the amount of funds available for use if you turned all of your current assets into cash and paid all current liabilities (which is a balance sheet measure) and then compares that amount to the value of farm production from the accrual income statement. Working Capital to Value of Farm Production ‘marries’ the balance sheet to the income statement to arrive at a ratio that evaluates one’s liquidity position relative to the size of the farming operation in dollars. The higher the WC/VFP ratio, the better the liquidity position from which to operate your farm. WC/VFP varies by farm type, farm revenue, age of the farm operator, and tenure.
You can easily make this calculation for your own farm. Use your December 31, 2013 Balance Sheet and your Accrual Income Statement for the year ending December 31, 2013. On the Balance Sheet, find your current assets and subtract your current liabilities from the current assets. (Be sure to include the current portion of your income taxes in your current liabilities.) Take that result and divide it by the value of farm production from your Accrual Income Statement. Now you have your answer! Think of WC/VFP in terms of a percentage. If your WC/VFP is 0.60, then you have 60% of the years’ revenue in a very liquid position for your farm. Among other things, this liquidity can provide cash to purchase operating inputs or make capital purchases. In 2011, the median WC/VFP was 0.60 for a group of 2,511 farms in the Illinois FBFM database. For that same group of farms at the 75th percentile, the WC/VFP was 0.98. For 2012 (2,599 farms), the median was 0.66 and the 75th percentile was 1.03. Both ratios for 2012 show stronger levels of liquidity. The ratio can vary throughout the production cycle mainly due to how current assets are used over the twelve month accounting cycle. A January 31 calculation of working capital can look vastly different from December 31 if one uses current assets and applies them to intermediate and long term debt. It is typical to measure WC/VFP at the same point in the cycle (December 31) to better compare the ratio from year to year.
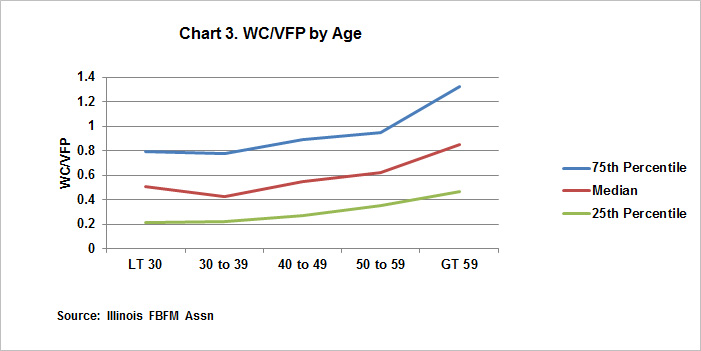
See Chart 1 to understand how WC/VFP is varies with the age of the farm operator. As age increases, the WC/VFP at all three marks increase as well.
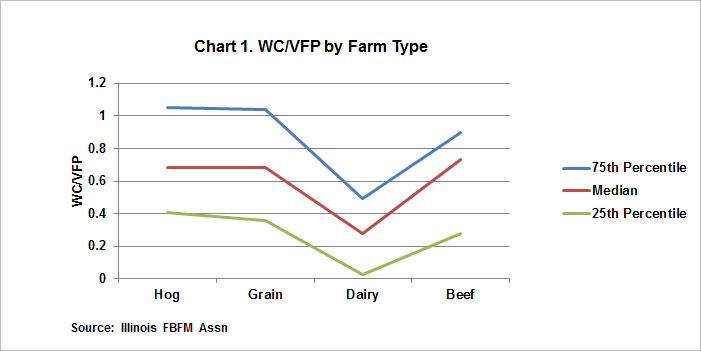
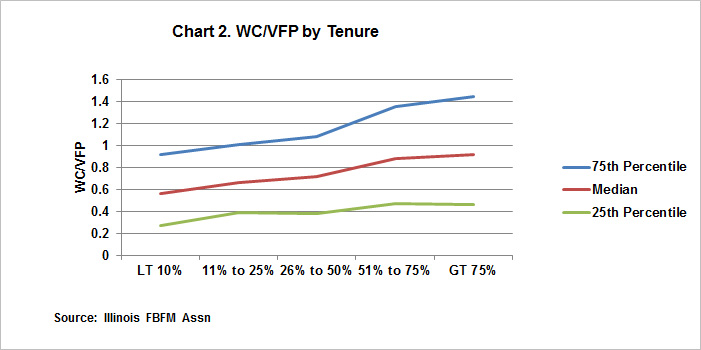
Chart 2 tells the WC/VFP story using the tenure ratio. As one owns’ a more substantial portion of the land one farms, the WC/VFP increases – again at all three marks.
Farm type impacts the WC/VFP. See Chart 3 to see how dairy farms tend to carry lower levels of WC/VFP and lower levels of liquidity in general. Hog and grain operations for 2012 appear to carry similar levels of liquidity as measured by WC/VFP with beef farms trailing just a bit.
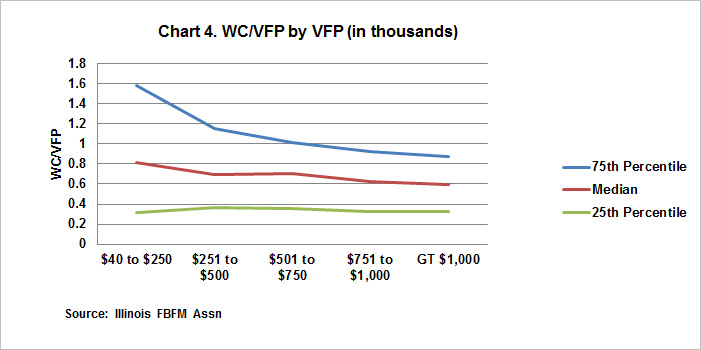
When compared by the size of farm as measured by VFP, the WC/VFP tends to be greater where the revenue is lower. Likewise, WC/VFP tends to be lower where farm revenue is at greater levels. See Chart 4 for details. One reason the lower revenue operations are at higher levels of WC/VFP could be due to an increased effect of off-farm income providing some liquidity to the farming enterprise. Presumably, higher levels of revenue indicate operations where the farming enterprise occupies a greater share of the operators time and management skills.
Click here to find other financial benchmarks for your farm.
Benchmarks and averages are powerful tools…the knowledge of how you compare with others is priceless as you seek to manage your farm operation to meet your definition of success. Use the concept of ‘average’ carefully – one can drown in a river that has an average depth of six inches. As we confront the challenges that lie ahead, taking comfort in what’s average might offer a false sense of security. Do your homework and assume the worst will happen…and make your plans accordingly so that the outcome meets with the goals and plan for your farm business.
The authors would like to acknowledge that data used in this study comes from the local Farm Business Farm Management (FBFM) Associations across the State of Illinois. Without their cooperation, information as comprehensive and accurate as this would not be available for educational purposes. FBFM, which consists of 5,500 plus farmers and 60 professional field staff, is a not-for-profit organization available to all farm operators in Illinois. FBFM field staff provide on-farm counsel along with recordkeeping, farm financial management, business entity planning and income tax management. For more information, please contact the State FBFM Office located at the University of Illinois Department of Agricultural and Consumer Economics at 217.333.5511 or visit the FBFM website at www.fbfm.org.

Disclaimer: We request all readers, electronic media and others follow our citation guidelines when re-posting articles from farmdoc daily. Guidelines are available here. The farmdoc daily website falls under University of Illinois copyright and intellectual property rights. For a detailed statement, please see the University of Illinois Copyright Information and Policies here.