


2013 Crop Insurance Performance in Illinois
With the recent addition of Group payments, most crop insurance payments likely have been entered into the Risk Management Agency’s Summary of Business, allowing an assessment of crop insurance loss performance for 2013. In Illinois, $661 million of insurance payments were made on all crops while total premiums were $823 million, leading to a 2013 loss ratio of .80. The .80 loss ratio was above the 2000-2012 average of .77, but below the 2012 loss ratio of 4.56. A factor contributing to insurance payments in 2013 was a price decrease for corn.
Crop Insurance Performance in Illinois
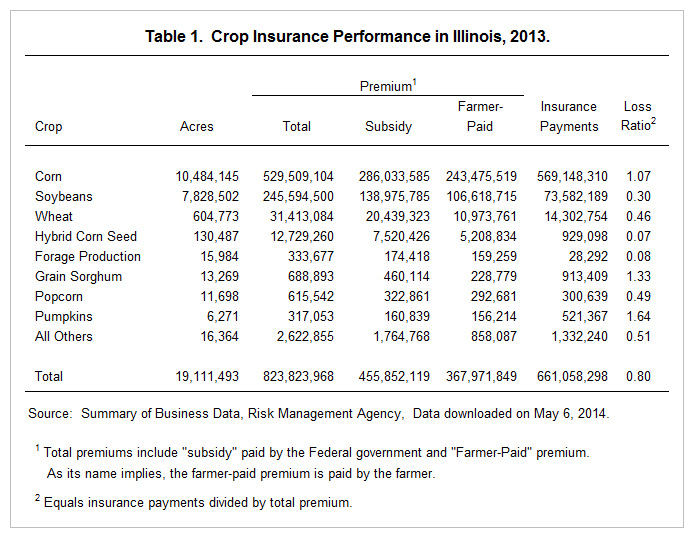
In 2013, there were 19.1 million acres insured in Illinois (see Table 1). On these acres, a total of $824 million of premium were paid, of which $368 million were paid by farmers and $456 million were risk subsidies. These subsidies are paid by the Federal government to crop insurance companies. Insurance payments in 2013 were $661 million.
In 2013, Illinois had a loss ratio of .80. The .80 loss ratio equals the $661 million of insurance payments divided by $824 million of total premium. The ratio being less than 1.00 implies insurance payments were less than total premium. Over time, loss ratios should average something close to 1.00. The .80 loss ratio in Illinois compares to a 2013 U.S. average loss ratio of 1.01. Adjacent states had loss ratios of 2.15 for Iowa, 1.51 for Wisconsin, .38 for Indiana, .37 for Kentucky, and 1.01 for Missouri.
The .80 loss ratio for Illinois was above the .77 average for 2000 through 2012. Loss ratios in recent years in Illinois were .30 in 2009, .57 in 2010, .43 in 2011, and 4.56 in 2012. The 2012 ratio was much higher, reflecting losses from the 2012 drought. The .80 loss ratio in 2013 is the second highest ratio since 2000.
Loss Performance by Crop
In 2013, total premium for corn was $530 million, soybeans was $246 million, and wheat was $31 million (see table 1). Corn represented 64% of total premium in Illinois, soybeans represented 30%, and wheat represented 4%. These three crops accounted for 97% of total premium in Illinois. Insurance performance of these three crops largely determine overall insurance performance in Illinois, with corn having the largest impact.
In 2013, corn had a 1.07 loss ratio. A general price decline contributed to corn losses. The 2013 projected price was $5.69 and the 2013 harvest price was $4.39, a decrease of 22%. Individuals purchasing revenue products at 80% and higher coverage levels had losses unless yields were above Trend-Adjusted Actual Production History yields.
Soybeans had a .30 loss ratio. In 2013, both the projected and harvest prices were $12.87 per bushel. For insurance payments to occur, yield losses had to occur. Many farmers have near to above average soybean yields, leading to few soybean insurance payments in 2013.
Summary
Losses experienced in Illinois during 2013 were considerably lower than the drought induced losses of 2012. The 2013 loss ratio was slightly higher than the 2000-2012 average. The harvest price for corn was 22% lower than the projected price. This decrease was a major factor contributing to corn payments in 2013.
Payments in this post are based on Summary of Business data from the Risk Management Agency. This data was accessed from the RMA website on May 6th. Insurance payments may increase as additional payments are recorded in RMA’s system. It is likely that the vast majority of payments have been already entered into the Summary of Business.
Disclaimer: We request all readers, electronic media and others follow our citation guidelines when re-posting articles from farmdoc daily. Guidelines are available here. The farmdoc daily website falls under University of Illinois copyright and intellectual property rights. For a detailed statement, please see the University of Illinois Copyright Information and Policies here.