Further Evidence on the Competitiveness of Ethanol in Gasoline Blends
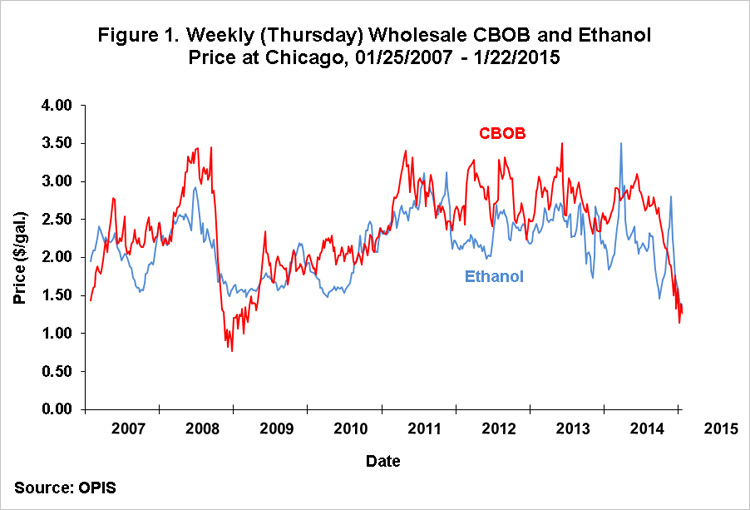
The sharp decline in gasoline prices beginning in the summer of 2014 and the persistence of relatively high ethanol prices (Figure 1) has raised questions about the competitiveness of ethanol in gasoline blends and the potential impact on ethanol and corn demand. In previous farmdoc daily articles (November 12, 2014, December 4, 2014) we addressed this issue from the perspective of the ratio of ethanol and CBOB prices that would be required to keep ethanol competitive in gasoline blends. Here, we address the issue from the perspective of the relationship of ethanol prices to the price of other octane enhancers. In particular, we consider the price of the aromatic compounds benzene, toluene, and xylene. These compounds have octane ratings generally similar to that of ethanol and have been routinely used as octane enhancers in gasoline blends.

Background
The transportation fuel we call “gasoline” is actually a blend of ethanol and a number of petroleum products, such as methane, butane, and naptha (see Leffler, 2008, Ch. 14). The blend of these products changes seasonally (due to weather and changes in emissions requirements) and as the relative prices of the various products change. Much like the price of feed ingredients in a least-cost feed ration, changes in the price of ethanol and the other petroleum products can influence the value of ethanol in the blend. Energy companies have developed sophisticated mathematical refinery models to determine optimal blends of the various gasoline components given prices and technical specifications.
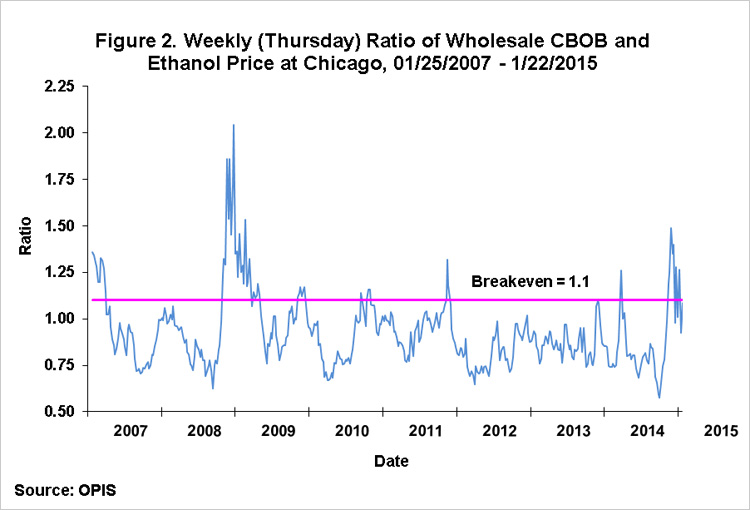
We are interested in the marginal value of ethanol in the gasoline blend as an octane enhancer. While ethanol has other chemical characteristics that may be beneficial, e.g., as an oxygenate, or detrimental, e.g., vapor pressure, there is ample evidence that the market value of ethanol is mainly determined by its relatively high octane rating. That is, holding the price of all other components constant, how does the octane value of ethanol in the blend change as the price of ethanol increases? This marginal value can be readily obtained using the mathematical models developed by energy companies. We are aware of only one study in the public domain that estimates the marginal value of ethanol using this type of optimizing algorithm. An engineering analysis by the U.S. Department of Energy (DOE) in November 2012 calculated a “…breakeven price of ethanol, above which it is more economic for the refiner to reduce ethanol volumes and alternatively produce more octane within the refinery.” That analysis indicated the breakeven ethanol price is about 10 percent higher than the price of CBOB gasoline. In other words, if the price of ethanol is less than 1.1 times the price of CBOB gasoline, there are positive economic returns to blending E10 for octane enhancement rather than producing octane from other petroleum processes in the refinery. We argued in the article of November 12 that other factors suggest that the breakeven ethanol and CBOB price ratio may be closer to 1.0 rather than 1.1. That conclusion is supported by the historical ratio of ethanol and CBOB prices that has rarely exceeded 1.1 and has averaged less than 1.0 (Figure 2). In sum, refinery blending economics are complicated, and unfortunately, only one study in the public domain analyzes the marginal value of ethanol as an octane enhancer using a mathematical refinery model.

Analysis of Octane Alternatives
While certainly not equivalent to a complete mathematical treatment of gasoline blending, a direct comparison of the price of ethanol and alternative sources of octane should shed further light on the question of the competitiveness of ethanol at the present time. The alternatives we consider are known as the “aromatic” compounds: benzene, toluene, and xylene. As noted earlier, these compounds have octane ratings generally similar to that of ethanol and have a long history as octane enhancers in gasoline blends. Aromatics are typically produced via high-pressure catalytic reformers in the same refineries that produce other petroleum feedstock for gasoline blending.
The weekly (Friday) prices of the three aromatic products and the price of ethanol at the U.S. Gulf are presented in Figure 3 for the period January 4, 2013 through January 16, 2015. The source for the aromatics price data is Bloomberg, while the ethanol data is from OPIS. During the indicated time period, benzene was the highest priced aromatic, sometimes by a wide margin, while the prices of toluene and xylene were very similar. Ethanol prices were almost always substantially lower than the price of the aromatics, with the gap narrowing late in the period.

The spreads between the aromatics and ethanol are depicted in Figure 4 using the ratio of the price of the aromatics to the price of ethanol. Throughout this time period ethanol was the lowest cost of the octane enhancers considered. The price of benzene averaged 1.87 times the price of ethanol, while toluene and xylene prices averaged 1.57 and 1.59, respectively, times the price of ethanol. Those latter two ratios declined close to 1.0 in late 2014 as the price of crude oil and refined products collapsed. The ratio has recently increased to about 1.3. Since the ratio has remained above 1.0, ethanol is still the lowest cost octane enhancer. From this perspective, blending economics continue to favor ethanol in terms of octane enhancement in gasoline. Just the opposite conclusion is reached based on Figure 2, which shows that the price of ethanol has been above the assumed 1.1 breakeven price ratio versus CBOB most of the time since last November. How to reconcile the two opposing results? One possibility is that the price comparison versus the aromatics omits important costs of including ethanol in the blend that are not present for the aromatics. This would lower the breakeven price ratio of the aromatics versus ethanol below 1.0. Another possibility is that the DOE analysis is biased in a manner that underestimates the true breakeven price ratio between ethanol and CBOB. Resolution of these conflicting results awaits full analysis using a refinery optimization model. The aromatics price comparisons presented here suggest to us that the DOE breakeven may be too low, rather than too high as we suggested in our November 12 article.

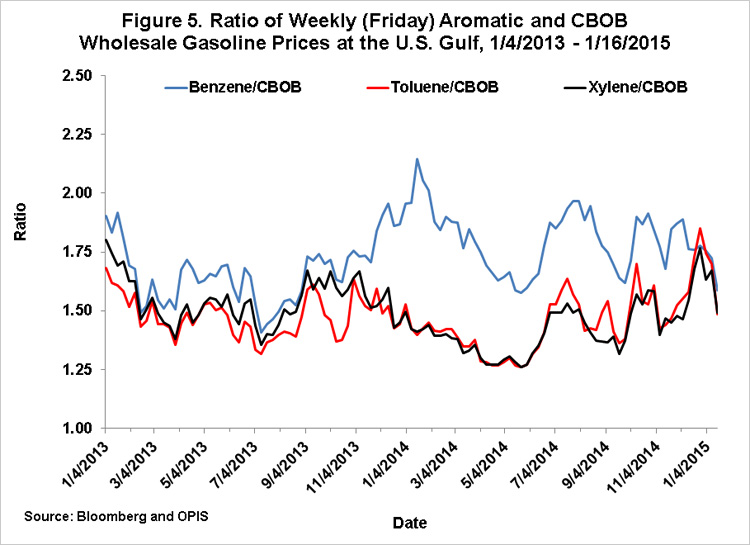
Since the real-time prices for the aromatics are generally available only by subscription and are not easily accessed, we examined the correlation of aromatic prices to CBOB prices to determine if the real-time price of aromatics could be approximated by the price of CBOB. For the two year period examined here, the correlation between the price of aromatics and the price of CBOB was 0.84, 0.89, and 0.87 for benzene, toluene, and xylene, respectively. Price ratios are presented in Figure 5, with the price of benzene averaging 1.78 times the price of CBOB, and toluene and xylene prices averaging 1.47 and 1.48, respectively, times the price of CBOB. While there was certainly some variation in these price ratios with CBOB, the ratios are stable enough that one could use the average ratio to benchmark aromatics prices based on CBOB prices.

Implications
Refinery economics are extremely important in evaluating the competitiveness of ethanol in gasoline blends, but refining is a complicated process that requires a sophisticated mathematical refinery model for a complete analysis. Here and in previous analyses we examine indicators of ethanol blending economics. Our previous analysis suggested that the recent decline in gasoline prices and the resulting higher ethanol/CBOB price ratios could be threatening the competitive position of ethanol in gasoline blends. The analysis presented here indicates that ethanol prices have indeed increased relative to the price of “aromatic” octane enhancers, but are currently well below the price of those alternatives. The price relationships versus the aromatics paint a much less threatening picture for ethanol blending. Most importantly, if the aromatic price comparisons are an accurate reflection of the marginal value of ethanol as a source of octane, then the RFS renewable mandate is not yet binding. This suggests the domestic market demand for ethanol remains at the E10 blend wall level (approximately 13.5 billion gallons), and consequently, corn use for ethanol is at least 4.8 billion bushels.
References
Environmental Protection Agency (EPA). "USDOE Analyses in Support of the EPA Evaluation of Waivers of the Renewable Fuel Standard (Ethanol Demand)." Released November 27, 2012, and accessed January 29, 2015. http://www.regulations.gov/#!documentDetail;D=EPA-HQ-OAR-2012-0632-2544
Irwin, S., and D. Good. "How Much Will Falling Gasoline Prices Affect Ethanol and Corn Demand?" farmdoc daily (4):232, Department of Agricultural and Consumer Economics, University of Illinois at Urbana-Champaign, December 4, 2014.
Irwin, S., and D. Good. "Do Falling Gasoline Prices Threaten the Competitiveness of Ethanol?" farmdoc daily (4):219, Department of Agricultural and Consumer Economics, University of Illinois at Urbana-Champaign, November 12, 2014.
Leffler, W.L. Petroleum Refining in Non-Technical Language, Fourth Edition, PennWell Corporation: Tulsa, OK, 2008.
Disclaimer: We request all readers, electronic media and others follow our citation guidelines when re-posting articles from farmdoc daily. Guidelines are available here. The farmdoc daily website falls under University of Illinois copyright and intellectual property rights. For a detailed statement, please see the University of Illinois Copyright Information and Policies here.


