More on ‘Is Bigger…Better’
The idea that larger farms have a more efficient cost structure was explored in the July 18, 2014 article. That earlier article looked at some of the variable costs (crop costs and power & equipment costs) that seem to be attention getting when considering economies of scale in farming.
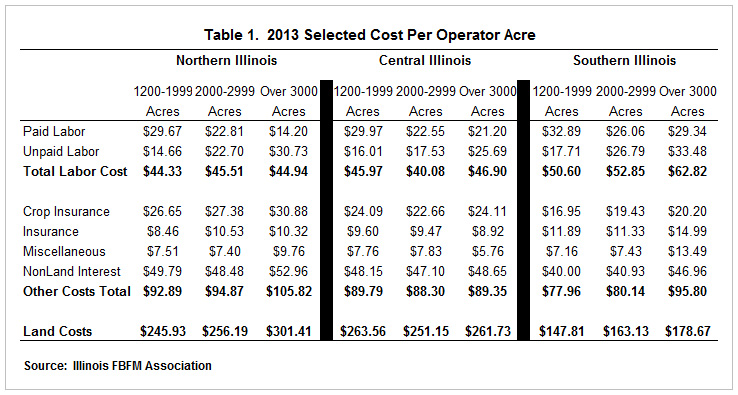
Let’s continue our thinking about the economies of size in three other areas of expense. This 2013 data again considers selected costs from three groups of farms – northern Illinois, central Illinois and southern Illinois.
Labor Costs
Generally, as number of acres increases within each of the three groups the ‘per acre’ paid labor cost decreases. Northern and central Illinois reveal this more starkly than southern Illinois. Of the northern Illinois groups, the 1200-1999 acre group had the highest paid labor cost of $29.67 and the 3,000+ acre farms had a paid labor cost of $14.20. The southern Illinois farms show a more steady paid labor per acre cost among the three groups with the 2000-2999 acre group showing the lowest cost per acre of $26.06. Interestingly, the unpaid labor cost per acre increases with each of the three groups as the average farm size increases. The northern Illinois group shows a doubling of the unpaid labor cost from $14.66 to $30.73. Central Illinois shows an increase not quite so large in percentage terms (60%) and southern Illinois reveals an 89% increase in unpaid labor cost from the group of smaller size farms to the larger size farms. (An unpaid labor charge is added to expenses to represent the value of the labor that the operator contributed to the farm.) It is interesting to note that the unpaid labor increases as farm size increases in all three regions of Illinois. One reason for this could be that there are more operators as farms get larger and more complex. Think of operators as family members and multiple operators is a proxy for multiple family members. This thought line would mean that there would be more operators for farm earnings to support – thus increasing the cost per acre.
Other Costs
Crop insurance costs vary between northern, central and southern Illinois as one might expect. Expected yield would be the chief driver of differences in crop insurance premiums and those yields would vary by soil type in the three regions. There is some variance between the acre groups in all three regions of the state, but crop insurance costs are more the same than they are different for the three different size groups within the three regions. General insurance costs vary a bit between regions; central Illinois shows the least cost presumably due to a lesser incidence of livestock buildings or grain handling facilities. Non-land interest is a calculated interest charge that represents an opportunity cost for all non-land assets of the farm operator. The non-land interest cost varied the least among the central Illinois groups of farms. There was a slight trend to a higher non-land interest cost on the larger farm groups in northern and southern Illinois.

Land Costs
Land costs are a weighted average of costs to control land – owned, crop shared or cash rented. The range in land cost (from highest to lowest) was greatest in northern Illinois and the least in central Illinois. Land costs in northern and southern Illinois show an overall trend of increasing as the farm size increases. Central Illinois land costs are somewhat similar to the northern Illinois land costs except for the 3,000+ acre group where the central Illinois land cost is lower. Southern Illinois land costs show an increasing trend as the average farm size increases.
Summary
As represented by 2013 data and the factors selected for this article, the greatest economy of scale is present in the paid labor expense. The other costs show little indication that an increasing farm size in acres is linked to a lower cost per acre.
The authors would like to acknowledge that data used in this study comes from the local Farm Business Farm Management (FBFM) Associations across the State of Illinois. Without their cooperation, information as comprehensive and accurate as this would not be available for educational purposes. FBFM, which consists of 5,700 plus farmers and 60 professional field staff, is a not-for-profit organization available to all farm operators in Illinois. FBFM field staff provide on-farm counsel with computerized recordkeeping, farm financial management, business entity planning and income tax management. For more information, please contact the State FBFM Office located at the University of Illinois Department of Agricultural and Consumer Economics at 217-333-5511 or visit the FBFM website at www.fbfm.org.
References
Krapf, B., D. Raab, and B. Zwilling. "Bigger is Better?" farmdoc daily (4):134, Department of Agricultural and Consumer Economics, University of Illinois, July 18, 2014.
Disclaimer: We request all readers, electronic media and others follow our citation guidelines when re-posting articles from farmdoc daily. Guidelines are available here. The farmdoc daily website falls under University of Illinois copyright and intellectual property rights. For a detailed statement, please see the University of Illinois Copyright Information and Policies here.


