


Some Key Trends in the World Soybean Market
Puzzlement about commodity prices is the norm; but puzzlement seems unusually high at present, at least in the opinion of the author. Therefore, this article will begin a 4 article series that looks at key trends in the world market for corn and soybeans, with the hope that understanding key trends might help frame the puzzlement – it is asking too much to resolve the puzzlement. This article specifically focuses on some key trends in the world soybean market other than the widely-discussed shift in production to South America and China’s dominant role in world soybean trade. Just to acknowledge these trends, between 2000 and 2014, U.S. share of world soybean production has dropped from 43% to 34% while Argentina and Brazil’s share has increased from 38% to 48%. China’s share of world soybean imports is currently 65%, compared with 24% in 2000. All data except where noted are from the U.S. Department of Agriculture’s WASDE (World Agricultural Supply and Demand Estimates), available here.
Framing the Price Puzzle Using World Stocks-to-Use Ratio
A simple, conventional analysis of price is to plot ending carryout stocks as a share of use against price. The notion is that price should be lower the higher is the carryout stocks-to-use ratio since more of the past’s year supply is available for future consumption. Figure 1 presents such a plot for world soybean ending stocks-to-use vs. U.S. crop year price. It begins with the 2007 crop year, or the first year of the recent price breakout. No statistically significant relationship exists. An R2 of 0.07 means world ending stocks-to-use explains only 7% of the variation in annual U.S. crop year average price. Moreover, the equation has a confidence level of 52%, well below any conventionally accepted test level.

Figure 2 presents a companion graph, specifically the trend in world soybean ending stocks-to-use since 2000. Clearly world soybean stocks-to-use is trending higher, with a statistical confidence that is nearly 99%. The trend is a 0.5 percentage point increase per year since 2000, which is a non-trivial increase, especially when accumulated over time. Moreover, the 2014 ending stocks-to-use ratio is the largest over this period, over 3 percentage points higher than the previous high. The latter is often followed by an expression of surprise on why soybean prices are not even lower.

Figure 3 provides context for Figure 2. The long term increase in world carryout stocks-to-use has been associated with a redistribution of world stocks. China’s share has increased at the rate of around 1 percentage point per year, counterbalancing declines in the share of world stocks held in both the U.S. and Brazil. In a related perspective, China’s ending stocks-to-use ratio increased from 12.0% on average during the 2000-2004 crop years to 21.4% on average during the 2010-2014 crop years. Stock holding in Argentina has drawn attention given the economic problems confronting the county. While Argentina’s share of world soybean stocks has increased, the key feature is China’s growing role as a holder of world soybean stocks.

Looking at World Demand
Discussion of world soybean demand has recently focused on concern over China’s slowing economic growth and slowing growth in soybean use. China’s use of soybeans was 51% higher in 2004 than in 2000. In 2014, it was 31% higher than in 2010. Not to minimize these concerns, it is important to keep in perspective that world soybean use has shown no signs of slowing, at least through 2014 (see Figure 4). R2 of the associated time trend regression is only 3%, which is not close to conventionally accepted levels of statistical significance. Since 2000, the annual change in world soybean use has averaged +4.0%. Moreover, only one year had a negative change (2008). Using data from the Food and Agriculture Organization (FAO) (http://faostat3.fao.org/home/E), the annual increase in world average soybean yield averaged 1.2% from 2000 through 2013. Thus, over this period, acreage planted to soybeans needed to increase annually by slightly less than 3% to meet the annual increase in world soybean use.
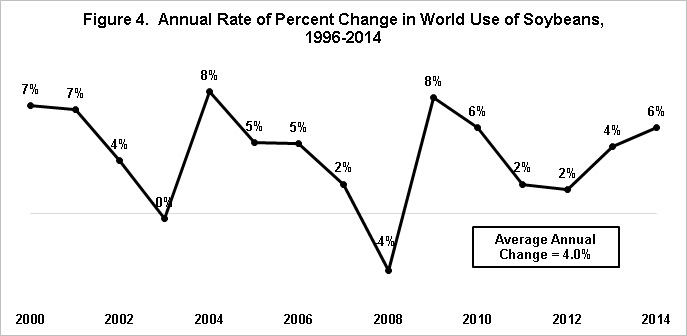
Figure 5 presents a companion graph to Figure 4, specifically the annual use of soybeans in China and the world since 2000 as measured in million metric tons. A simple, linear trendline is fit to the data, revealing that since 2000, the average annual increase in use of soybeans has been 4.3 million metric tons for China and 7.7 million metric tons for the world. The year-to-year consistency of both of these trends is striking, as illustrated by an R2 for the linear time trend that is slightly less than 100%. An annual average increase of 7.7 million metric tons is equivalent to an annual average increase of 282 million bushels or 5.9 million harvested acres using the U.S. harvested yield of 47.8 bushels per acre for the 2014 crop.

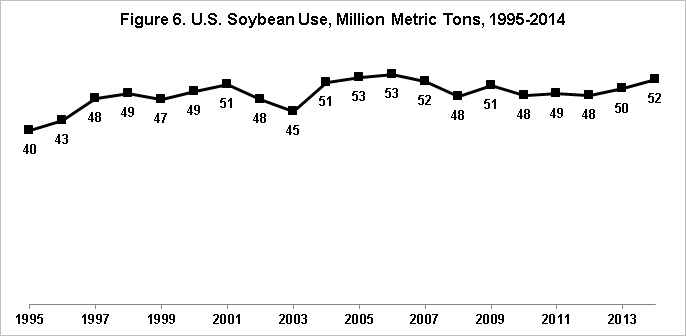
The increase in world soybean use since 2000 is even more striking when it is placed in the context of essentially no growth in U.S. soybean use since 2000 (see Figure 6). This graph is extended back to 1995 to illustrate that soybean use increased nearly 10 million metric tons between 1995 and 2000, before essentially plateauing. An obvious candidate for explaining this plateau is the growth in distillers dried grain as a feed by-product of the surge higher in ethanol production. Corn used to produce ethanol grew from just under 1 billion bushels during the 2002 crop year to a projected 5.2 billion bushels during the current 2014 crop year (equivalently, from 25 to 132 million metric tons).
Summary Observations
- Puzzlement about commodity prices is the norm; but puzzlement seems unusually high at present for soybean prices.
- World stocks-to-use ratios are at recent highs after a large crop in the U.S. and a likely large crop in South America. China’s economic growth is slowing, as is growth of its soybean imports. These are undeniably negative price factors. On the other hand, the continued growth in soybean use worldwide is notable. This growth has outpaced yield increases resulting in the need for non-trivial annual increases in acres planted to soybeans. Moreover, it is reasonable to speculate that, if the growth in U.S. ethanol production has reached a plateau, U.S. use of soybeans may start to grow once again. As is always in order, historical trends may not continue into the future. This fact makes forecasting both so interesting and so frustrating.
- Into this mix comes the increase in stocks held by China. What does China view as a suitable amount? What happens when it stops building stocks? The world soybean market is notably different than the world cotton market, but will some features of the current world cotton market make its way into the world soybean market? China is currently projected to hold 59% of ending 2014 world cotton stocks and its cotton stocks equal 184% of its projected 2014 use of cotton. Questions about China’s intentions with regard to its stocks, quality of its stocks, etc. are key items of discussion in the world cotton market. It is important to underscore, the world soybean market is currently much different than the world cotton market, but the situation with regard to China’s stocks of soybeans bears watching.
- In conclusion, the soybean market is a world market. Understanding this market means looking beyond the territorial waters of the U.S. It means not just following production in South America and demand in China. Demand growth comes from around the world. Stockholding policy may emerge as a new pricing factor. Maybe the feeling of puzzlement reflects the struggle with the new reality of how all these pieces fit together as the world soybean market reinvents itself?
References
USDA Office of the Chief Economist. "World Agricultural Supply and Demand Estimates (WASDE)." http://www.usda.gov/oce/index.htm
Disclaimer: We request all readers, electronic media and others follow our citation guidelines when re-posting articles from farmdoc daily. Guidelines are available here. The farmdoc daily website falls under University of Illinois copyright and intellectual property rights. For a detailed statement, please see the University of Illinois Copyright Information and Policies here.