


Is the Corn Belt Farm Economy too Specialized?
Economic cycles often provide benefits to some and harm others. For example, rising grain prices are simultaneously celebrated by crop producers who enjoy increased revenues and vilified by livestock producers who suffer from increasing production costs. It has been argued that the Corn Belt’s farm economy is particularly vulnerable to economic cycles as the result of increased commodity specialization. This article shows that, contrary to popular belief, the farm economy of the Corn Belt is as diverse as it was in 1930.
In real terms, the animal sector accounted for roughly 76.3% of the value of agricultural production in the Corn Belt in 1930, but by 2013, this share declined to just 37.3%. (The Corn Belt is defined as Illinois, Indiana, Iowa, Missouri, and Ohio.) At the national level, the animal sector’s share of value of production has remained relatively stable, declining slightly from 57.4% in 1930 to 45.5% in 2013. Before the 1970s, the animal sector accounted for a greater share of the Corn Belt farm economy than it did for the nation as a whole. Many interpret this shift away from livestock production as evidence of decreasing diversity in agricultural production across the region, and this trend has been criticized for a number of reasons, including adverse environmental impacts and increased vulnerability to crop price cycles. That is, many suspect that the Corn Belt farm economy is overly specialized and greatly exposed to adverse price movements in just a few commodities.

However, there is evidence that the economic diversity of commodities produced in the Corn Belt has changed very little since the 1930s. This can be seen by examining an empirical measure of the diversity of the economy, provided by Shannon’s Diversity Index. Shannon’s Diversity Index was developed as a measure of biodiversity of a landscape. It tracks the abundance of various species in a given location. Its minimum (of zero) is observed when a population contains only a single species, and Shannon’s Diversity Index increases as the number of species increases or the proportional distribution of species becomes more equitable.1 That is, the measure increases when animals are spread more evenly across species.
Figure 2 plots Shannon’s Diversity Index for US and Corn Belt agricultural production as measured by the cash receipts for various commodities. USDA’s Economic Research Service classifies agricultural cash receipts using four categories of livestock and related products (meat animals, milk and dairy products, poultry and eggs, and miscellaneous livestock) and eight categories of crops (food grains, feed crops, cotton, tobacco, oil crops, vegetables and melons, fruits and vegetables, and all other crops).2 A Shannon’s Diversity Index of cash receipts therefore measures the degree to which the agricultural economy is comprised of one or many commodities and the relative share of total cash receipts by commodity.
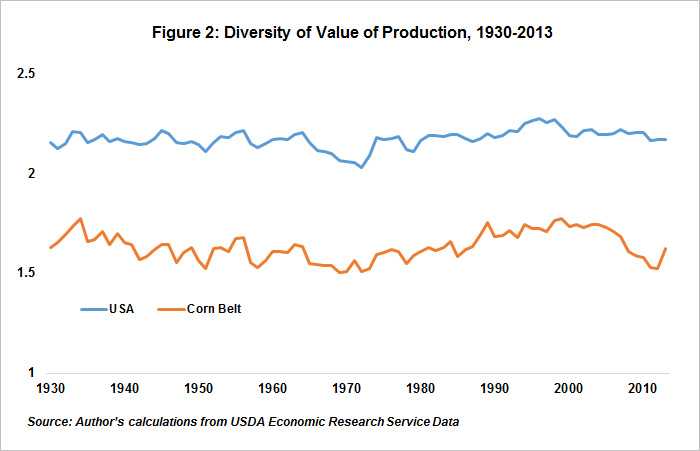
The index is expected to decline if the economy is dominated by the production of only a few commodities. However, the diversity index suggests that the farm economy of the nation and the Corn Belt region has remained relatively stable since the 1930s. The Corn Belt farm economy grew gradually less diverse from 1930 through 1970 but increased at similar rate through the early 2000s and again declined after 2004. A slight uptick in 2013 showed that, in that year, Shannon’s Diversity Index for cash receipts by commodity type was the same as it was in 1930. Further, while the Corn Belt is understandably less economically diverse than the nation as a whole, this difference has remained consistent.
Thus, empirical evidence suggests that the Corn Belt’s agricultural production is as economically diverse as it was more than 80 years ago.
References
ERS/USDA. Current Data Sources for Farm Income and Expenditure Estimates 2009-12. Last updated February 10, 2015, accessed April 10, 2015. http://ers.usda.gov/data-products/farm-income-and-wealth-statistics/general-documentation.aspx
Notes
1Shannon's Diversity Index is calculated:
where pi is the proportion of observations classified as category i and S is the total number of categories.
![]()
2Full documentation for ERS' cash receipts database can be found here.
Disclaimer: We request all readers, electronic media and others follow our citation guidelines when re-posting articles from farmdoc daily. Guidelines are available here. The farmdoc daily website falls under University of Illinois copyright and intellectual property rights. For a detailed statement, please see the University of Illinois Copyright Information and Policies here.