Crop Progress and Implications for 2015 Prevented Planting in Corn and Soybeans
Based on USDA’s March 30 Prospective Plantings report corn planted area was estimated at 89.2 million acres and soybean planted area was estimated at a record 84.6 million acres. Based on this data, and incorporating USDA’s June 8 Crop Progress report, 2 percent of intended corn acres and 21 percent of intended soybean acres remain unplanted as of last week. For soybeans the percent of planted acres through June 7 falls short of last year’s planting pace by 7 percentage points but is only two percentage points below the five-year average of 81 percent planted on June 7. Unplanted corn acres total 1.9 million acres and are concentrated in the Southwest and Western Plains, Figure 1. Unplanted soybean acres total 18 million and are concentrated in the Southwest and Western Corn Belt areas, Figure 2.
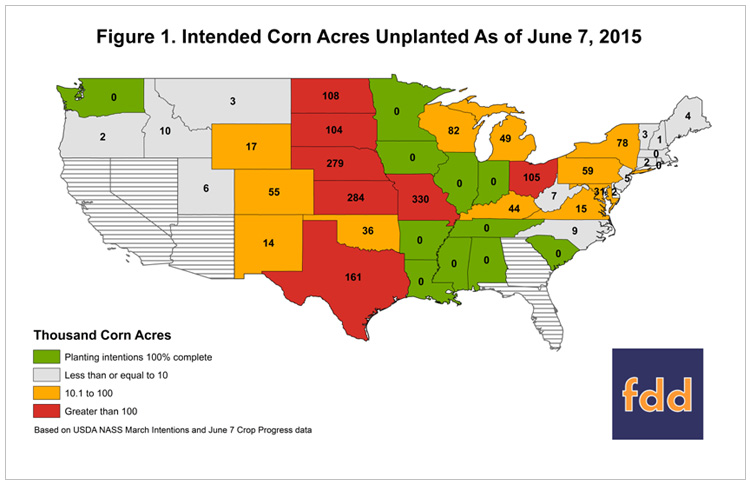
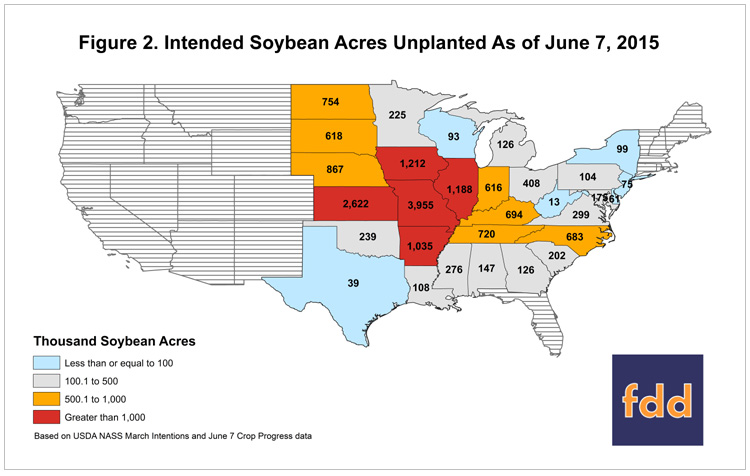
The areas with significant amounts of unplanted corn and soybean acres correspond to parts of the U.S. receiving abnormally large amounts of rainfall this planting season (National Weather Service, 2015). During the last 30 days many states in the Western Corn Belt and Southwest have received well above 100 percent of the normal participation amount. In parts of Kansas and Missouri, for example, precipitation has been as much as 600 percent above average, and as a result soybean planting progress stands at only 31 percent and 30 percent, respectively. Both states are 50 percentage points below last year’s soybean planting pace and as of June 7 account for 6.6 million soybean acres unplanted. The last seven days have not brought much relief, with many areas in Kansas and Missouri still receiving one to eight inches of above average precipitation. Due to these adverse weather conditions planting has been significantly delayed and the yield response associated with delayed or late planting could be measurable. Acreage already planted but subject to these adverse weather conditions may need to be replanted or may go unharvested.
In a previous farmdoc daily article (May 20, 2015) yield penalties associated with delayed or late planting for corn were reviewed. Specifically, USDA’s crop-weather model reveals that for each percentage of the U.S. corn crop planted late 0.289 bushels per acre are lost (Westcott and Jewison, 2013). The actual yield response is not linear, however, and at some point in time it is no longer timely to plant the crop. Final planting dates vary by crop and by area, but after such dates, prevented planting payments can be taken if areas have not been planted due to weather-related problems (farmdoc daily, March 12, 2013; May 30, 2013). Given the magnitude of unplanted corn and soybean acres, and in the face of recent rainfall amounts, a portion of the remaining corn and soybean acres may qualify to receive prevented planting payments. Prevented planting payments provide crop insurance benefits to policy holders and may exceed the economic returns brought by a late-planted crop.
While not the same as USDA’s Risk Management Agency acreage data, USDA’s Farm Service Agency (FSA) does maintain Crop Acreage Data by crop year from 1996 to 2014. This data includes, among other information, county-level data on planted acres, failed acres, and prevented plantings for a variety of crops.[1] Today’s article uses this data to review historical patterns in prevented plantings to provide insight on potential prevented plantings for 2015.
History of Prevent Planted Acreage
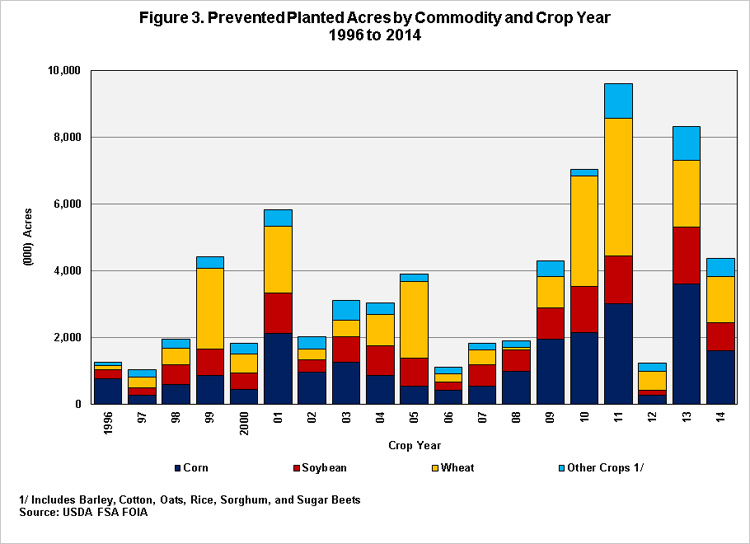
Adverse weather events which may delay or prevent planting occur randomly. As a result, acres designated as prevented plantings vary each crop year. From 1996 to 2014 the range of prevented planted acres for nine principal crops were as low as 1 million acres in 1997 to as high as 9.6 million acres in 2011, and averaged 3.6 million acres, Figure 3. As examples, in 2012, a near perfect spring resulted in prevent plantings of only 1.2 million acres. Then, in 2013, due to the wet spring 8.3 million acres were designated as prevent plantings. Finally, this past year, improved weather conditions resulted in only 4.4 million prevented planted acres. With respect to the commodities representing prevented planted acreage, corn, soybeans, and wheat account for 34 percent, 21 percent, and 34 percent of prevented plantings from 1996 to 2014 respectively.
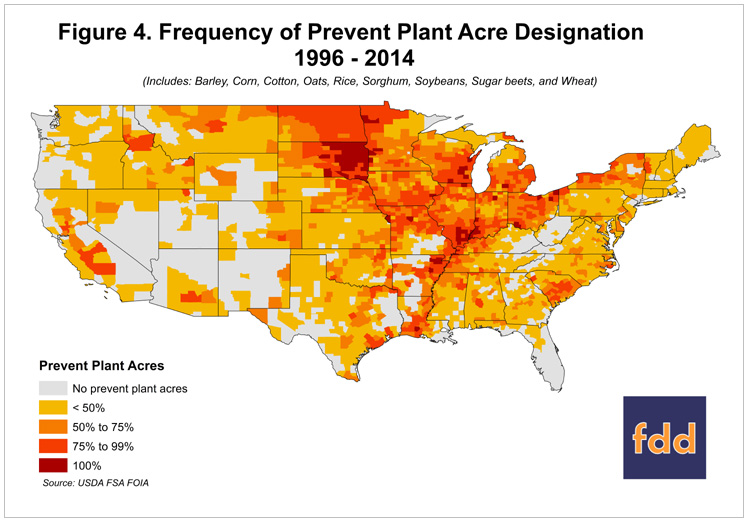
While adverse weather events are generally not systemic, evidence on prevented plantings data shows that the frequency of prevented plantings is greater in the Upper Midwest and along the Mississippi River. During the 19-year period analyzed 77 counties had prevented planted acreage reported during all years, and over 1,100 counties had prevented plantings at least 50 percent of the years, Figure 4. The dispersion of prevented planted acres speaks to the diversity of risks in crop production, however, the frequency of prevented planted acreage in concentrated areas points toward some cropland areas being more risky production locations with tighter planting windows and a higher frequency of unfavorable weather conditions. Weather conditions in 2015 imply prevented plantings could be above average in portions of the Southwest and Western Corn Belt.
Early Evidence for 2015
With corn acreage mostly in the ground for 2015, and less than 2 million acres unplanted, there is no evidence that prevented planted acreage for corn will differ significantly from the historical average of 1.2 million acres. Expectations are for some of the unplanted corn acreage to be planted late or allocated to other crops with later planting windows. Thus, it is unlikely that a 2013 or 2011 type environment for corn could emerge where greater than 3 million acres are designated as prevent plant.
Attention naturally turns to soybean acres with only 79 percent of the intended acres planted. However, while among one of the lowest planting paces in recent years, this planting progress does not differ significantly from the five-year average of 81 percent. Due to more favorable weather conditions this past week (in some areas) it is anticipated that planting progress will improve in USDA’s June 15 Crop Progress report, lowering the magnitude of potential unplanted acres. However, with Kansas and Missouri lagging the rest of the U.S. by as much as 50 percentage points it is reasonable to expect a portion of those 6.6 million acres to fall into prevented plantings.
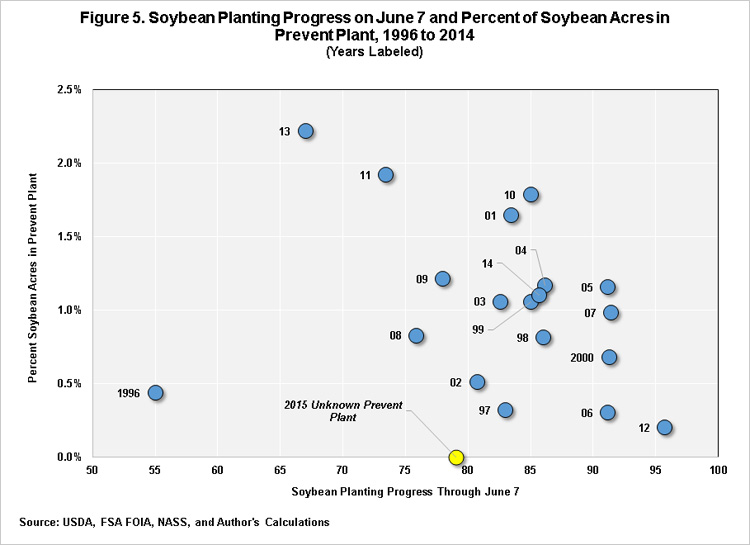
Figure 5 shows the historical relationship between U.S. soybean planting progress through June 7 and the percent of U.S. soybean acres in prevent plant. Since 1996 only five crop years have had a slower soybean planting progress. Yet, in all of those years the percent in prevent plant does not unanimously support high acreage in prevented plantings. Instead, the magnitude of soybean acres in prevent plant ranges from 0.44 percent in 1996 to a high of 2.22 percent in 2013. Applying these percentages to March 2015 intentions implies an average of 1.1 million acres with a range of 372 thousand to a record of 1.9 million soybean acres in prevented plantings. Unplanted acres in Kansas and Missouri lend support to this expectation.
However, the yield penalty in soybeans is not as steep as in corn and several weeks remain before final planting dates for soybeans. Thus it is likely that farmers in Arkansas, Kansas, Missouri, Illinois, and Iowa will close the gap on planting progress. Historically, prevented planted acres in soybeans have ranged from a low of 225 thousand acres to a high of 1.7 million acres, and averaged 759 thousand acres. Current expectations are for above average prevented plantings in soybeans due to the ongoing persistence of wet weather and the magnitude of acres unplanted. USDA’s June 30 Acreage report will provide an update on planted acreage for corn and soybeans and also an opportunity to revise estimates on the magnitude of 2015 prevented plantings. However, it is important to keep in mind that the June acreage numbers may still reflect a fair amount of intentions rather than actual acreage in the wet areas.
References
Irwin, S., D. Good, and J. Newton. "Early Planting and 2015 Corn Yield Prospects: How Much of an Increase?" farmdoc daily (5):93, Department of Agricultural and Consumer Economics, University of Illinois at Urbana-Champaign, May 20, 2015.
Westcott, Paul C., and Michael Jewison. "Weather Effects on Expected Corn and Soybean Yields." FDS-13g-01, Economic Research Service/USDA, July 2013. http://www.ers.usda.gov/media/1152952/fds-13g-01.pdf
Schnitkey, G. "Evaluating Taking Prevented Planting Payments for Corn." farmdoc daily (3):103, Department of Agricultural and Consumer Economics, University of Illinois at Urbana-Champaign, May 30, 2013.
Schnitkey, G. "Early Planting and Final Planting Dates for Crop Insurance." farmdoc daily (3):47, Department of Agricultural and Consumer Economics, University of Illinois at Urbana-Champaign, March 12, 2013.
NASS/USDA. Prospective Plantings. Released March 30, 2015, accessed June 11, 2015. http://usda.mannlib.cornell.edu/usda/nass/ProsPlan//2010s/2015/ProsPlan-03-31-2015.pdf
NASS/USDA. Crop Progress. Released June 8, 2015, accessed June 11, 2015. http://usda.mannlib.cornell.edu/usda/nass/CropProg//2010s/2015/CropProg-06-08-2015.pdf
Note
[1] Data is publically available for 2007 to present. For this article all data was obtained through a Freedom of Information Act request.
Disclaimer: We request all readers, electronic media and others follow our citation guidelines when re-posting articles from farmdoc daily. Guidelines are available here. The farmdoc daily website falls under University of Illinois copyright and intellectual property rights. For a detailed statement, please see the University of Illinois Copyright Information and Policies here.


