


ACRE Potential Payments in Historical Perspective
Introduction
The Average Crop Revenue Program (ACRE) was the first commodity revenue program authorized by a farm bill (2008 farm bill). The 2014 farm bill redesigned ACRE into the Agriculture Risk Coverage program (ARC). Since participation in ACRE was limited, this article assesses potential payments that ACRE would have made if all program acres had been in it. The analysis uses 2009-2013 crop year parameters announced for ACRE by FSA (Farm Service Agency). ACRE is briefly compared with ARC in the next section. Potential payments are discussed for the program as a whole and by individual crop and state, as well as compared with actual payments and foregone direct payments. Summary observations are then drawn.
Key ACRE vs. ARC differences
- ACRE used state yield; ARC uses county or farm yield.
- ACRE’s coverage range was 67.5% to 90%; ARC’s is 76% to 86%.
- ACRE generally paid on a share of planted acres; ARC pays on a share of historic base acres.
- ACRE used a 2-year moving average of U.S. crop year price; ARC uses a 5-year Olympic moving average (excludes high and low values).
Analysis
Potential payments by ACRE for a crop-state-year combination were estimated using planted acres, FSA’s announced payment rates, and ACRE’s payment factor of 83.5% or 85%, depending on the year. ACRE’s individual farm loss requirement was incorporated using Zulauf, Schnitkey and Langemeier’s estimate that this provision reduced payments by 10%. Several estimation issues exist. Potential payments were underestimated because FSA did not provide payment rates for some crop-state-year combinations, usually when no farm elected ACRE, or because data were not available for planted acres or by irrigated / non-irrigated acres from the National Agricultural Statistical Service QuickStats website. In contrast, ACRE potential payments were overestimated because of the lack of farm level data. This constraint precluded incorporating the limits on payments to a payment entity and the base acre cap on a FSA farm’s ACRE payment acres. Net impact of these estimation issues on potential ACRE payments is not clear, but should be kept in mind when assessing the results. The sources for various FSA data used in this article are included in the references.
Total Potential Payments
Estimated potential payments by ACRE for the 2009-2013 crop years total $7.95 billion (see Figure 1). Potential payments were highest in 2013, followed by 2009 and 2012. A major U.S. drought occurred in 2012. In contrast, 2009 and 2013 for most program crops and states were characterized by yields higher than the Olympic average of state yield for the 5 prior crop years and by prices lower than the U.S. price for the 2 prior crop years.
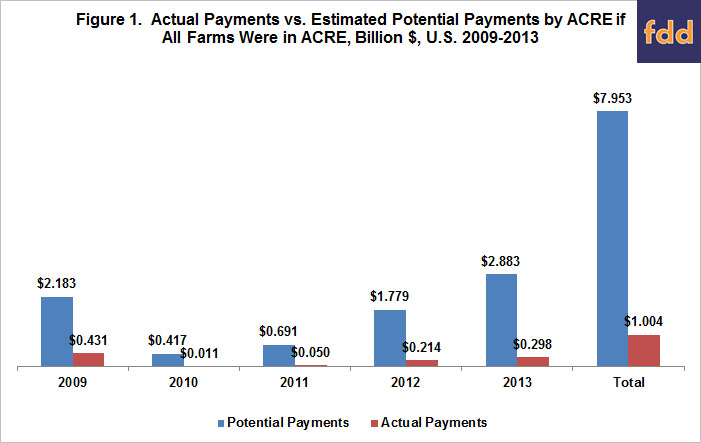
Actual payments by ACRE totaled $1.00 billion (see Figure 1). Participation peaked at 8.3% of FSA farms and 13.9% of FSA base acres for the 2012 crop year. Crop year 2009 wheat accounted for 30% of total actual ACRE payments.
Prior to ACRE, farm bill commodity programs were based on price. To gain insights into revenue programs, potential payments were calculated if ACRE had been implemented as a price program. Specifically, payments were estimated as (state benchmark yield times the difference, if positive, between average U.S. price for the 2 prior crop years minus U.S. crop year price). Potential price-only payments were estimated to be $6.20 billion, implying that enacting ACRE as a revenue instead of price program increased payments by $1.75 billion or 28%.
Potential payments were also calculated if ACRE had been implemented as a yield program. Payments were estimated as (state benchmark price times the difference, if positive, between the Olympic average state yield for the 5 prior crop years minus state crop year yield). Potential yield-only payments were estimated to be $7.7 billion, or higher than price-only payments. Unsurprisingly given the magnitude of the 2012 drought, yield-only payments were highest for 2012, equaling $4.1 billion. However, yield-only payments also averaged $0.9 billion over the other 4 years. The size of the yield-only payments underscores the importance of yield in determining payments by a revenue program.
Potential ACRE Payments by Crop
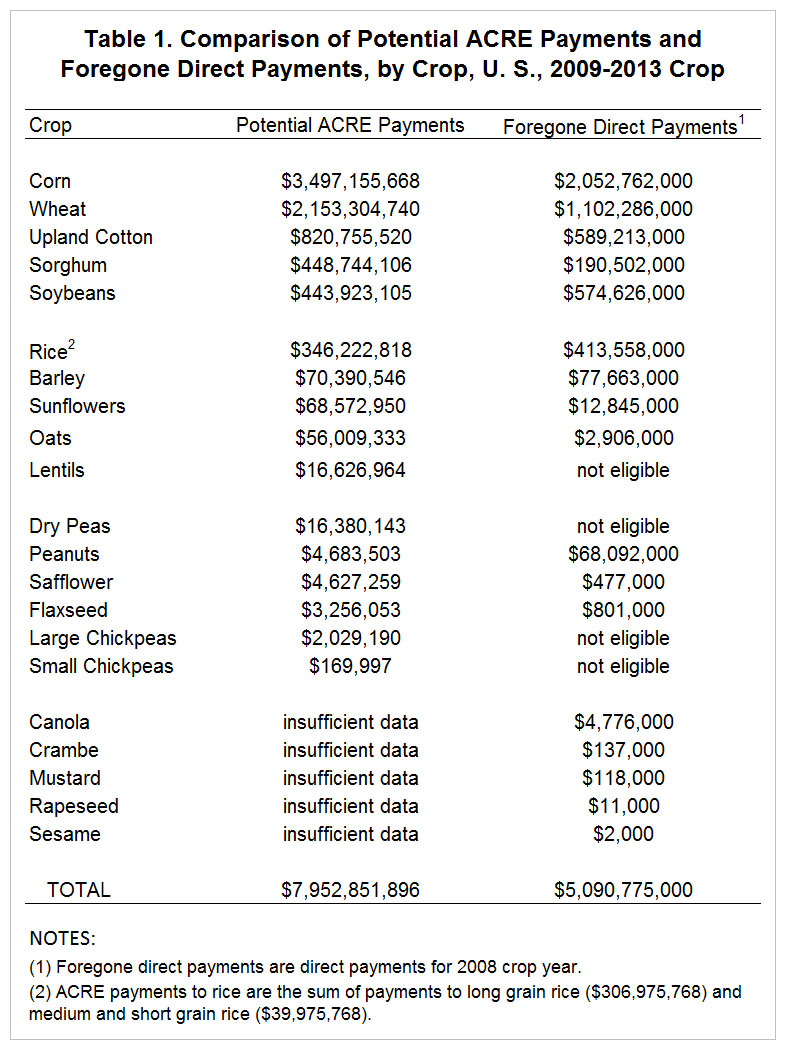
Due to missing data on payment rates or planted acres, potential ACRE payments could not be estimated for canola, crambe, mustard, rapeseed, and sesame. Of the remaining 16 program crops, 6 accounted for 97% of all potential ACRE revenue payments: corn, wheat, upland cotton, sorghum, soybeans, and rice (see Table 1). Corn (44%) and wheat (27%) together accounted for over 70% of all potential ACRE payments.
Potential ACRE Payments by State
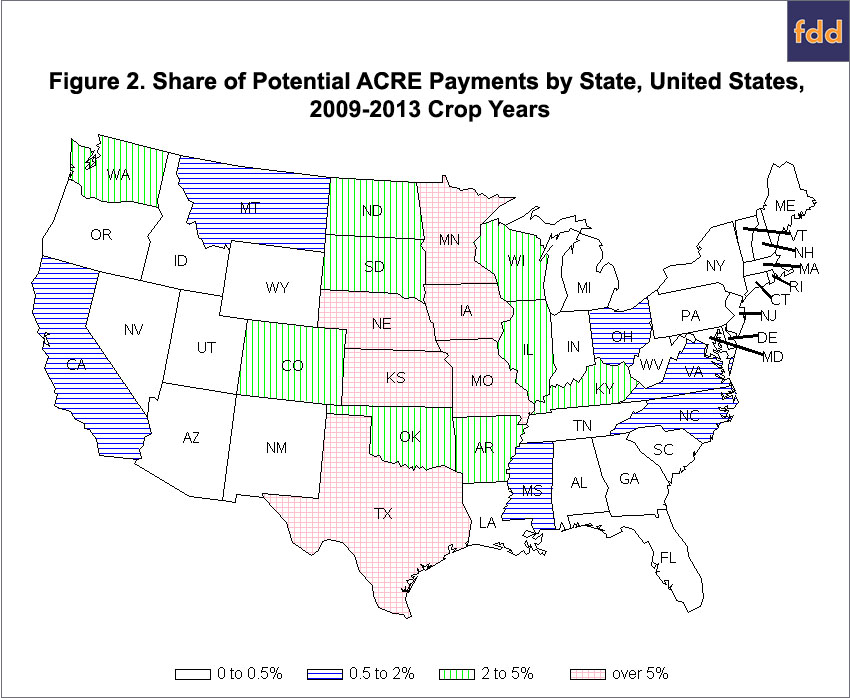
Of the 15 states whose share of potential ACRE payments exceeds 2%, 11 lie between the Mississippi River and Rocky Mountains (see Figure 2). These 11 states have sizable acres of program crops, particularly the large potential ACRE payment crops of corn and wheat. Only 2 states had a double digit share of ACRE payments, Texas (21%) and Kansas (11%). These 2 states also had the highest standard deviation of state average yield for corn and wheat among the 15 states with the most corn and wheat acres.
Potential ACRE vs. Foregone Direct Payments
Over the 5 crop years from 2009 through 2013, the 20% required reduction in direct payments each year sums to a single year of direct payments. Total foregone direct payments thus were measured as the direct payments for 2008, the crop year before ACRE began. Direct payments for 2008 totaled $5.09 billion, or 36% less than total potential ACRE payments. This finding is for the U.S. and does not mean each FSA farm would have received more potential payments from ACRE than its foregone direct payments. Potential ACRE payments were less than foregone direct payments only for barley, peanuts, soybeans, and rice (see Table 1). The correlation between potential ACRE payments and foregone direct payments is +0.98 for the crops in Table 1 (+1 is perfect correlation). Peanuts is a notable exception as its potential ACRE payments would have been only 7% of its foregone direct payments. When analyzed by state instead of crop, the correlation is lower: +0.77. However, payment shares differ by more than 2 percentage points for only 7 states. These states, with their ACRE share minus direct payment share in parenthesis, are Texas (+12.8), Kansas (+4.5), Nebraska (+2.4), Oklahoma (+2.1), Ohio (-2.7), Indiana (-4.1), and Illinois (-5.3).
Summary Observations
- Participation in ACRE was low, but potential ACRE payments would have exceeded foregone direct payments over the 2009-2013 crop years. This situation may simply reflect that participation was an uncertain, forward-looking decision while this analysis is a certain, backward looking examination. This conventional explanation implies that certainty of payment was a major factor in farmers’ decisions, as studies have pointed out (see Edwards, and Woolverton and Young). However, an alternative perspective also exists: farmers do not understand the size of revenue risk, particularly across multiple years.
- Potential ACRE payments both align with and differ from the debate that surrounded it. ACRE was championed by corn, a clear potential beneficiary. But, so were other crops, including wheat and upland cotton, which did not champion ACRE. This situation may reflect the limited sample of 5 years of data, but again, may also reflect that farmers do not understand revenue risk.
- The senior author has been continually struck by how difficult it is for farmers to think in terms of revenue. He also has experienced this difficulty. Farmers (and he) are much better at thinking in terms of yield and price. Thinking in terms of revenue is not the same as multiplying price by yield. It also requires understanding the future variability of both yield and price and how their variability interacts. Ironically, price-based commodity farm programs and yield-based crop insurance may have contributed to farmers’ difficulty in thinking in terms of revenue by separating price from revenue and yield from revenue.
- The discussions that surrounded the ACRE and ARC participation decisions suggest that the decisions primarily were made in terms of price expectations. Yet, examination of potential ACRE payments repeatedly points toward the important role that yield variability plays in determining revenue payments. Not understanding yield’s role may lead to an incorrect participation decision for revenue programs, and again is consistent with not understanding revenue variability.
- Change in public policy is easier when change impacts the distribution of program benefits as little as possible. The generally similar distributions of potential ACRE payments and direct payments implies commodity revenue programs are likely evolutionary, not revolutionary policy change.
References
Edwards, W. M. 2011. "Why Was ACRE a No-Go with Iowa Farmers?" Choices: The Magazine of Food, Farm, and Resource Issues. 26(4th Quarter). http://www.choicesmagazine.org/choices-magazine
USDA/FSA. Commodity Estimates Book and Reports. Accessed various dates during 2015. http://www.fsa.usda.gov/about-fsa/budget-and-performance-management/budget/commodity-estimates-book-and-reports/index
USDA/FSA. "Direct and Counter-Cyclical Automation for State and County Offices." 2-DCP Revision. December 29, 2014. https://www.fsa.usda.gov/Internet/FSA_File/2-dcp_r01_a38.pdf
USDA/FSA. Direct and Counter-Cyclical Program / ACRE. Accessed various dates during 2015. http://www.fsa.usda.gov/programs-and-services/dccp-acre/index and http://www.fsa.usda.gov/programs-and-services/dccp-acre/dcp-acre-enroll-data/index
Woolverton, A., and Young, E. (2009). Factors Influencing ACRE Program Enrollment. USDA Economic Research Service, Economic Research Report Number 84. http://www.ers.usda.gov/media/136650/err84_1_.pdf
Zulauf, C., G. Schnitkey, and M. Langemeier. 2011. "Analysis of ACRE's Farm Eligibility Condition." Ohio State University, Department of Agricultural, Environmental, and Development Economics.
Disclaimer: We request all readers, electronic media and others follow our citation guidelines when re-posting articles from farmdoc daily. Guidelines are available here. The farmdoc daily website falls under University of Illinois copyright and intellectual property rights. For a detailed statement, please see the University of Illinois Copyright Information and Policies here.