


Examining Factors Affecting Long Term Corn and Soybean Prices
The recent decline in farm prices have underscored a question that has existed throughout the recent period of higher prices, has a new era of farm prices emerged? An excellent argument for a new higher price era was laid out by Scott Irwin and Darrel Good in their March 29, 2011 farmdoc daily article. As is usual among economists, disagreement exists concerning a new era. This article joins the discussion by using market history to identify key factors that have helped shape current corn and soybean prices. Supply and demand features of world grain and oilseed markets since the early 1970s are reviewed. The role of input productivity, input prices, and inflation are examined. The article concludes with a discussion of what this review of history suggests are key indicators and questions as markets seek to resolve the questions of long term corn and soybean prices and thus whether a new era has emerged.
Data Sources
Prices of U.S. corn, soybeans, and farm inputs are from QuickStats, U.S. Department of Agriculture (USDA), National Agricultural Statistics Service. Gross domestic implicit price deflator (GDP deflator) is from the Economic Report of the President, 2016. World grain and oilseed supply and demand data are from Production, Supply and Distribution Online, USDA, Foreign Agriculture Service (FAS). U.S. agricultural productivity is from Agricultural Productivity in the U.S., USDA, Economic Research Service.
Review of Corn and Soybean Prices
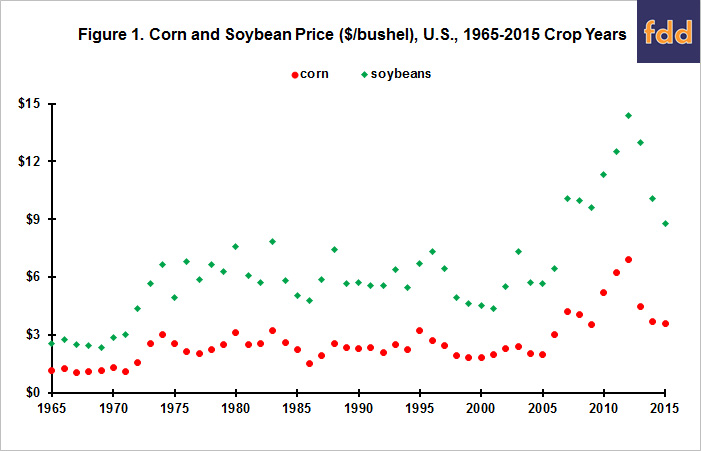
Two price jumps, one in 1972, the other in 2006; define the corn and soybean price chart of the last half century (Figure 1). Corn and soybean prices averaged 97% and 110% higher during 1973-2006 than 1965-1972. Since 2006, they have averaged 95% and 85% higher than during 1973-2006. Corn prices jumped almost the same both times while soybean prices jumped somewhat less post 2006 than post 1972. This comparison suggests the 1972 price jump was more about soybeans while the 2006 price jump was more about corn.
World Grain Supply and Demand
The study starts with 1973, the year after the 1972 price jump. FAS data begins with 1960. Its coverage has expanded over time but particularly in 1972 for oilseeds when peanuts were added and countries with data for sunflowerseeds expanded from 4 to 33. Supply and demand variables examined are consumption, which FAS reports as domestic consumption, yield, and acres harvested, as well as ending stock-consumption ratio. The grains data set used in this study is composed of barley, corn, millet, mixed grains, oats, rice (milled), rye, sorghum, and wheat.
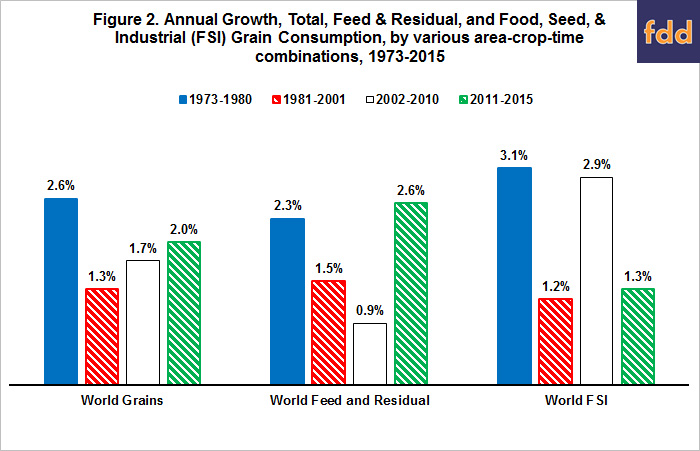
A key contributor to the 2006 price jump was increased consumption of grain for industrial uses, in particular corn for ethanol. However, FAS does not report consumption of grains for industrial use separately, but includes it in a category titled food, seed, and industrial use (FSI). The other category of grain consumption is feed and residual use (subsequently referred to as feed use). Growth in world grain consumption is calculated in total and for these 2 categories over 4 periods. One is 2002-2010. Crop year 2002 was the first in which U.S. consumption of corn for ethanol increased by more than 100 million bushels after removing DDG production. U.S. corn used for ethanol after removing DDGs continued to increase at or above this threshold through the 2010 crop year. Since 2010, the increase has slowed to only 146 million bushels in total through 2015. The other periods are the 1973-1980 period of farm prosperity and the remaining periods of 1981-2001 and 2011-2015.
Average annual growth of world grain FSI consumption more than doubled in 2002-2010 (2.9%) compared with 1981-2001 (1.2%) (Figure 2). As a result, annual growth in total world consumption of grains increased from 1.3% to 1.7%. Unsurprisingly, higher prices reduced the annual growth in feed use from 1.5% to 0.9%. However, since 2010 feed use has grown faster than even during 1973-1980. In fact, its rate of increase has more than offset the sharp decline in FSI growth since 2010, resulting in a faster growth in total world consumption of grains since 2010 (2.0%) than during the ethanol boom of 2002-2010 (1.7%). Moreover, in 2015, world feed and residual use of grains is nearly the same as if its 1.5% growth rate over 1981-2001 had continued through 2015.
In contrast to the varying growth rates of world grain consumption, world grain yield grew at a relatively constant rate of around 1.7% per year (Figure 3). Moreover, annual variability declined. Using 2 equal length sub-periods, standard deviation of yield was 4.6% vs. 3.0% over 1973-1993 vs. 1994-2015.

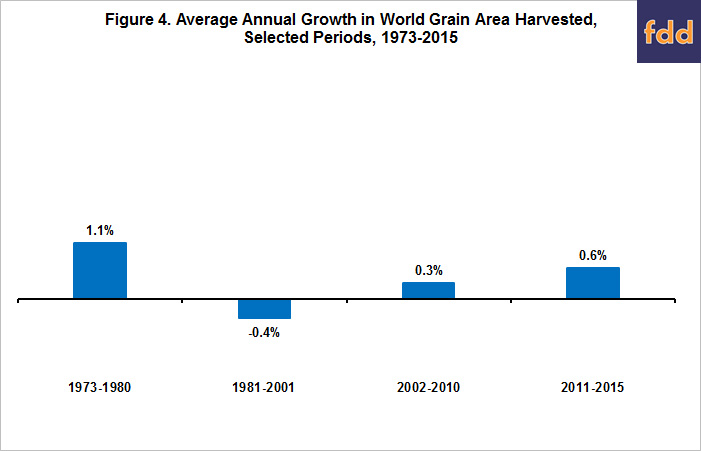
World harvested grain area declined 0.4% per year during 1981-2001 (Figure 4) as world grain yield grew faster than world total grain consumption. This decline reversed after 2002 as world grain consumption grew faster than world grain yield. Over 2011-2015, harvested grain area increased the fastest since the 1970s, putting downward pressure on corn (and soybean) prices.
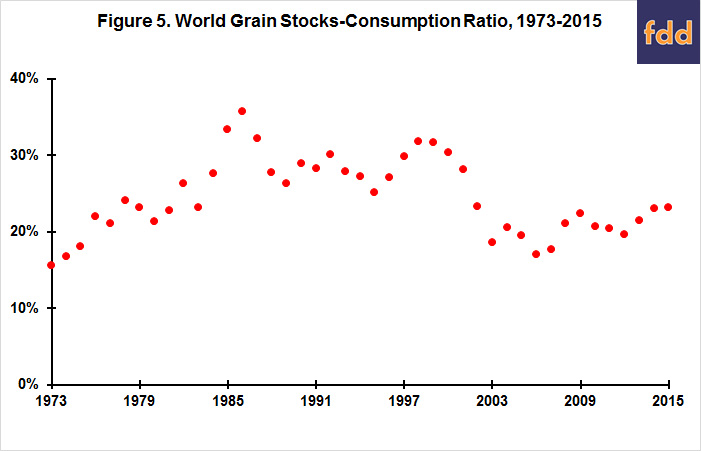
In 2003 world grain ending stock-consumption ratio declined below the lowest 1981-2001 ratio (18.6% in 2003 vs. 22.7% in 1981) (Figure 5). The ratio remained below the 1981-2001 minimum until 2014 and 2015. Nevertheless, the 2015 ratio (23.2%) remains well below the 1981-2001 average (28.7%).
World Oilseed Supply and Demand
Since yield is a variable of interest and since copra and palm kernel are from trees, not field crops; they are not included in the oilseed data set used in this study. The data set is composed of cottonseed, peanuts, rapeseed, soybeans, and sunflowerseed.
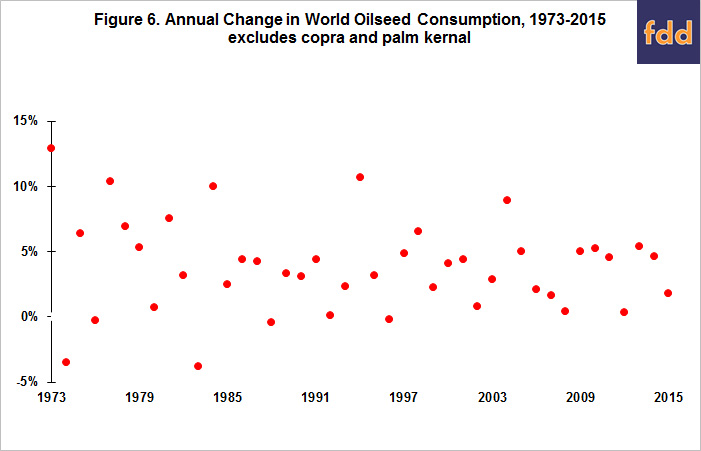
Unlike world grains, no obvious, well-defined change in annual growth of world oilseed consumption (Figure 6), yield (Figure 7), and harvested area (Figure 8) is discernable, except for faster growth in consumption during the 1970s: 4.9% in 1973-1980 vs. 3.6% since. The annual variation in yield growth makes it difficult to conclude with any degree of certainty that world oilseed yield growth is slowing. Annual variability of the growth in world oilseed consumption has clearly declined – from 4.1% during 1973-1993 to 2.3% during 1994-2015. Standard deviation of annual growth in yield and harvested area has also declined but much less so: 5.8% to 4.7% and 3.5% to 2.9%, respectively. A more likely explanation for the decline in annual variability in the growth of world oilseed consumption is the steady increase in the world oilseed ending stock-consumption ratio (Figure 9). It is also worth noting that variability of world yield has consistently been higher for oilseeds than for grains.


Price of Inputs
Figure 10 presents one of the strongest empirical relationships for the U.S. farm sector – the ratio of prices farmers pay for agricultural production inputs to the prices they receive for all crops compared against total input productivity of the farm sector. The figure begins with 1960, the first year of the productivity data. The close relationship reflects that, as input productivity increases, farmers can afford to pay higher prices for inputs for a given level of output prices. Because input productivity has increased over time, the gap between input and output prices has also widened. This increasing gap is represented by the upward trend in Figure 10.

Figure 10 also implies that, for a given level of input productivity, input and output prices will follow each other. If productivity does not change by much and crop prices decline, input prices will decline, and vice versa. Since 1972, the inflation-adjusted, real price index of all U.S. crops declined by more than 20% over 3 multiple year periods – 1980-1987, 1996-2000, and 2012-2015 (Figure 11). The decline is calculated from the first to last year, with the first year in each period having the highest real price and the last year having the lowest real price. Because general price inflation can affect farm input and output prices and because general price inflation varied across these periods; all price series are deflated using the GDP deflator. The GDP deflator is usually considered the most accurate measure of economy wide inflation.
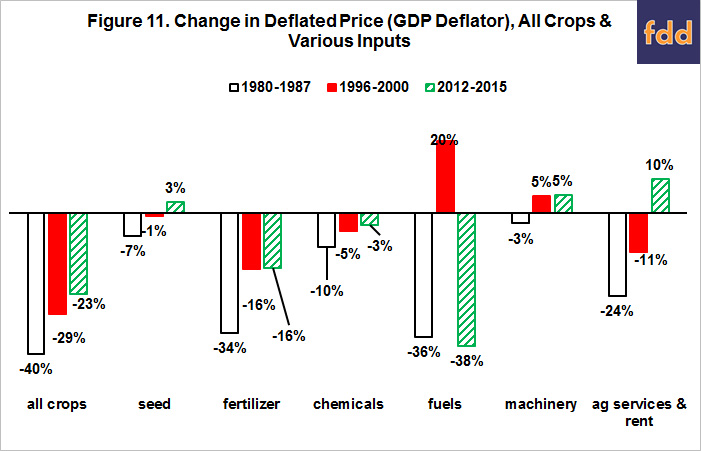
Unsurprisingly, a general pattern of real input price decline emerges in each period of large declines in real crop prices. Real prices for chemicals and, especially, fertilizer declined in all 3 periods. The real price of fuels declined the most of any input in the earliest and latest periods, but increased in the second period. Inflation-adjusted agricultural services and rents declined in the first two periods but has continued to increase during the current period. Rent is available as a separate input category since 1990. Real rent decreased by 18% in 1996-2001, but has increased by 14% in 2012-2015.
Figure 10 further implies that, if the input-output price ratio moves away from factor productivity, the two will eventually converge. For 2014 and 2015, the ratio of agricultural input prices to all crop prices increased notably. Factor productivity is not yet available for these years, so it is not possible to assess whether the input-output price ratio is now abnormally high relative to factor productivity or whether factor productivity also jumped higher in these years. The resolution of this question will provide important insights into how severe current economic pressures are for U.S. farmers as a group.
Declining Real Prices of Farm Commodities
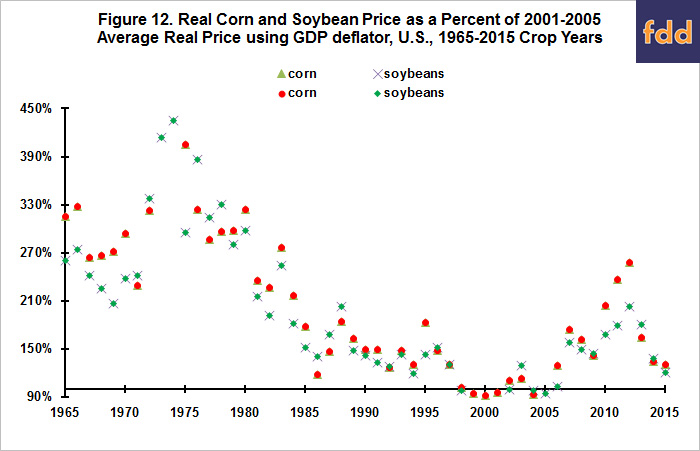
A feature of prices received by U.S. farmers since the early 20th Century has been a declining inflation-adjusted, real value. This decline allowed U.S. consumers to reallocate spending from food to other areas of consumption, thus improving their economic quality of life. Figure 12 presents a snapshot of this trend for corn and soybeans since 1965, using the GDP deflator to calculate real prices. To facilitate discussion, real prices are expressed as a percent of their average for 2001-2005, the period of lowest real corn and soybeans prices since 1965. Real corn and soybeans prices increased in the mid-1970s, but resumed their long term decline by the early 1980s. Real corn and soybean prices again moved higher after 2005, peaking in 2012. Since 2012 real corn and soybean prices have declined notably towards their 2001-2005 real values; however, they remain 33% and 22%, respectively, above the 2001-2005 averages. The decline mostly reflects lower current dollar prices of corn and soybeans since U.S. inflation has been so low recently.
Summary Thoughts and Observations
- A key question confronting the outlook for U.S. corn and soybean prices is what is their long term equilibrium?
- In considering this question, it is important to acknowledge that U.S. corn and soybeans exist in the broader world grain and oilseed markets. These broader markets must be understood.
- The review of world grain and oilseed supply and demand over the last 40 plus years suggests a key factor determining future corn and soybean prices will be which increases faster: world grain yield or world grain consumption? The answer will determine if more land is needed for grain production or if land in grains can be shifted to meet the growing demand for oilseeds?
- While future growth of grains as a source of biofuels will be a key factor influencing world consumption of grains, a more important factor likely will be whether the increased growth in world consumption of grains for feed since 2010 can be sustained or whether it is a temporary increase that returned world feed consumption back to its pre-ethanol growth path?
- A decline in crop yields is a widely discussed concern. This review finds no clear evidence that the growth of aggregate world yields of grains and oilseeds is slowing. Evidence is found that suggests the annual variability of these yields, in particular grain yield, may be declining.
- Another key question is what is the normal level of stocks? Ending stock-consumption ratios have increased for world oilseeds, likely stabilizing the annual growth in world oilseed consumption. Has this ratio now reached a normal level and no longer needs to build? For world grains, have changes in world transportation infrastructure, an apparent decline in world yield variability, and the recent growth of corn production in the Southern Hemisphere lowered the normal level of world grain stocks? Or is the market understating the risks of production and other supply chain factors? In short, is the normal world grain ending stock-consumption ratio closer to the 1981-2001 average or the 2002-2010 average? Your answer to this question and the question posed for oilseed stocks profoundly changes your interpretation of the current level of world grain and oilseed stocks.
- A factor that compounds understanding long term corn and soybean prices is the recent decline in input prices. Lower input prices, everything else the same, increases profitability and thus either increases supply or dampens the downward pressure on it. While exceptions are common, input prices in general follow crop prices during large crop price moves. Thus, it is important to ask how much can current input prices decline and how will crop prices react to their decline?
- Rent has increased during the current crop price pullback. Will rent eventually decline? It declined by double digits during the two other large crop price pullbacks since 1973?
- The lack of decline in rents raises the question of how widespread is the current stress in U.S. agriculture? Raising this question does not mean stress has not increased, particularly for individual farmers. But, for the sector as a whole is the current stress about adjustment to a more normal supply-demand situation from a very prosperous situation or is it a deeper stress? An early indicator will be how many acres of corn and soybeans, more broadly crops, do U.S. farmers plant this year? The higher the number of acres planted the lower the indication of aggregate stress.
- The strong evidence that input prices in general decline when farm output prices decline raises an important question with farm policy and management implications: How risky is farming?
- While a historical trend does not always continue into the future, it is important to consider it and to have a rationale for why it no longer applies. Otherwise, a reasonable guess is that the historical trend will reassert itself. It is thus useful to keep in mind that the 2001-2005 real price of corn and soybeans adjusted for inflation since 2005 implies a crop year price for corn and soybeans of $2.70 and $7.20, respectively. To be more specific, unless world grain consumption continues to grow faster than world grain yield or unless world consumption of oilseeds grows faster than its historical rate, such as via biofuels; it is reasonable to expect that over time real corn and soybeans prices will work their way toward these real price levels. Note, this is not a price forecast for the coming crop year. It is what history suggests the underlying price pressure over the longer run could be.
- In summary, the sharp decline in corn and soybean prices since 2012 may be coming to an end and higher prices may be ahead as the string of good world weather is replaced by more normal or stressful weather, or demand growth accelerates. However, history suggests it is also possible that further declines are ahead. This article has not attempted to answer which scenario is more likely. Instead, it has pointed out key relationships and questions that a historical review of world grain and oilseed markets suggests you should monitor as these dynamic markets answer which scenario emerges. However, because further declines are potentially possible, this review clearly implies that effective management requires attention to the possibility of this outcome and thus aggressive management of costs and input productivity is in order.
References
Irwin, S., and D. Good. "A New Era in Crop Prices?" farmdoc daily (1):27, Department of Agricultural and Consumer Economics, University of Illinois at Urbana-Champaign, March 29, 2011.
USDA Economic Research Service. Agricultural Productivity in the U.S. Updated December 14, 2015, accessed March 11, 2016. http://www.ers.usda.gov/data-products/agricultural-productivity-in-the-us.aspx
USDA/NASS. QuickStats. http://quickstats.nass.usda.gov/.
U. S. Foreign Agricultural Service. Production, Supply and Distribution Online. https://apps.fas.usda.gov/psdonline/psdHome.aspx
U. S. Government Publishing Office. Economic Report of the President, 2016. https://www.gpo.gov/fdsys/browse/collection.action?collectionCode=ERP
Disclaimer: We request all readers, electronic media and others follow our citation guidelines when re-posting articles from farmdoc daily. Guidelines are available here. The farmdoc daily website falls under University of Illinois copyright and intellectual property rights. For a detailed statement, please see the University of Illinois Copyright Information and Policies here.