


What Do Prospective Plantings Tell Us About Planted Acreage?
Prospective Plantings reports are survey-based estimates of producer planting intentions that are typically released at the end of March and reflect producer responses to the March Agricultural Survey. Good and Irwin (2011) provide a thorough review of the survey procedures used by the USDA. As one of the first indications of the upcoming supply for the new crop year, these reports have been shown to have significant impacts on commodity markets (e.g. Dorfman and Karali, 2015; Xie et al, 2016). However, like any survey-based estimates, Prospective Plantings are subject to sampling and non-sampling errors. While USDA goes to a great extent to minimize potential errors through their survey design and reported data review procedures, some error is unavoidable. The purpose of this article is to assess reliability of Prospective Plantings estimates based on their track record over the last 20 years. In doing so, we are expanding on brief reliability analyses published at the end of each prospective plantings report and taking a more detailed look at the errors associated with these estimates. Several earlier farmdoc daily articles (e.g., April 4, 2014; October 15, 2015; January 27, 2016) examine additional issues related to USDA acreage reports.
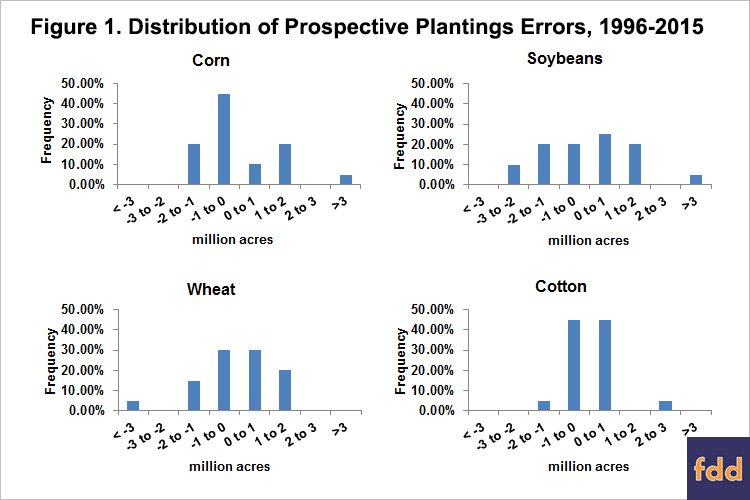
Prospective Plantings Errors
In summary, our review of Prospective Plantings errors over the last 20 years shown in figure 1 indicates that the differences between corn planted acreage and prospective plantings remained within a +/-3% range or under 2 million acres 95% of the time. Corn prospective plantings were within 1 million acres greater than planted acreage 45% of the time. Soybean prospective plantings errors remained within 3% (under 2 million acres) 80% of the time and within 4% (under 3 million acres) 95% of the time. Cotton errors were less than 1 million acres 90% of the time. Wheat errors remained within 3% (under 2 million acres) 95% of the time and under 1 million acres 60% of the time. Prospective Plantings were unbiased estimates of planted acreage most of the time except in the periods of acreage contraction when corn and cotton prospective plantings tended to overestimate planted acreage.
Prospective Plantings Reliability on Average
Table 1 shows the average values of planted acreage and their standard deviations for corn, soybeans, wheat and cotton over 1996-2015. This information provides background on relative variability in acreage planted based on the coefficients of variation. As the table shows, soybean acreage planted is relatively less variable while cotton acreage planted is relatively more variable among these commodities.

The difference between the final estimate of planted acreage and prospective plantings can be regarded as error and examined in both acres and percentages. Mean absolute error and Root mean squared error illustrate the average magnitude of the difference between the estimate and the final value, thus the average error of corn prospective plantings is 1,042 thousand acres or 1.48% of the planted acreage. Cotton prospective plantings errors appear smallest in acres (628 thousand) but largest in percentage terms (6.29%).
Average (mean) errors are examined to determine whether positive errors are offset by the negative errors to make sure there is no consistent bias in Prospective Plantings estimates. The t-tests in table 1 indicate that the mean errors are not significantly different from zero at the conventional confidence levels, suggesting that Prospective Plantings have been unbiased estimates of planted acreage over the last 20 years. While corn forecast errors were less than 3.5% even in extreme cases (max and min), other crops, particularly cotton, showed much larger errors reaching an overestimation by 12% in 2007 and an underestimation by almost 15% in 2011. In acreage terms, soybeans and wheat have seen some of the largest errors with overestimation by 3,744 thousand acres in wheat in 2011 and underestimation by 3,296 thousand acres in soybeans in 2012.
Prospective Plantings Reliability by Scenario
Table 2 breaks down our analysis for different types of errors and allows to take a closer look at the different situations in which the errors may be made. The first two sets of results confirm the lack of bias in Prospective Plantings as there are roughly the same amount of positive and negative errors except for corn where we have more negative errors but the size of positive errors is slightly bigger. At the same time the size of negative errors appears slightly bigger in cotton and wheat.

The next set of results looks at the size of errors for the years of acreage expansion that were correctly characterized as such by Prospective Plantings estimates. These result show no bias in predicting acreage expansion by prospective plantings reports. On the other hand, in years of acreage contraction, average forecast errors for corn and cotton are negative and significantly different from zero indicating overestimation of planted acreage (or underestimation of contraction) by about 0.77% or 640 thousand acres and by 3.53% or 419 thousand acres, respectively. Incorrect prediction of expansion or contraction in planted acreage by prospective planting estimates was rare in all commodities except soybeans and limited to years with small acreage changes. In 3 cases when it happened in the wheat market, prospective plantings indicated wheat acreage contraction relative to the previous year, instead acreage turned out to expand, which means that prospective plantings underestimated planted acreage by about 1.45% or 849 thousand acres.
Implications
Looking forward to the next Prospective Plantings report that will be released on March 31, 2016, our findings imply that while these estimates will not be equal to the June 2016 planted acreage numbers or the final planted acreage released in January 2017, they will be within a 3% margin of error for corn, soybeans and wheat and within a 1 million acre margin of error for cotton in the vast majority of the time. On average, we can expect corn prospective plantings estimates to be 1.042 million acres or 1.48% different from the final planted acreage numbers. Prospective plantings tend to be “off” from the final planted acreage by 1.290 million acres or 2.10% for soybeans, 0.915 million acres or 2.11% for wheat and 0.628 million acres or 6.29% for cotton. Most of the time, Prospective Plantings are unbiased estimates of final planted acreage, meaning that they neither overestimate or underestimate the final numbers. However, the situations to watch out for are associated with acreage contraction. Thus, if USDA will report that corn acreage will be down from what it was last year, they will likely underestimate this acreage reduction by 0.77% or 640 thousand acres. Similarly, if cotton acreage is down from last year, USDA will likely underestimate this acreage reduction by 3.53% or 419 thousand acres. No bias associated with acreage contraction has been detected in soybeans or wheat.
Note – March 29, 2016: This article has been modified from the original version published on March 25, 2016.
References
Dorfman, J. H. and Karali, B. (2015) A Nonparametric Search for Information Effects from USDA Reports, Journal of Agricultural and Resource Economics. Volume 40, Number 1, (http://purl.umn.edu/197380).
Good, D., and S. Irwin. "Using FSA Acreage Data to Project NASS January Planted Acreage Estimates for Corn and Soybeans." farmdoc daily (6):17, Department of Agricultural and Consumer Economics, University of Illinois at Urbana-Champaign, January 27, 2016.
Good, D., and S. Irwin. "Progression of USDA Corn and Soybean Acreage Estimates and Prospects for Final Estimates for 2015."farmdoc daily (5):191, Department of Agricultural and Consumer Economics, University of Illinois at Urbana-Champaign, October 15, 2015.
Good, D., and S. Irwin. "Are There Acres Missing from the USDA's Prospective Plantings Report?" farmdoc daily (4):61, Department of Agricultural and Consumer Economics, University of Illinois at Urbana-Champaign, April 4, 2014.
Good, D., and S. Irwin. "USDA Corn and Soybean Acreage Estimates and Yield Forecasts: Dispelling Myths and Misunderstandings." Marketing and Outlook Brief MOBR 11-02, Department of Agricultural and Consumer Economics, University of Illinois at Urbana-Champaign, March 2011.
Xie, R., O. Isengildina-Massa, G.P. Dwyer, and J.L. Sharp. (2016) The Impact of Public and Semi-public Information on Cotton Futures Market, Applied Economics, (forthcoming).
Disclaimer: We request all readers, electronic media and others follow our citation guidelines when re-posting articles from farmdoc daily. Guidelines are available here. The farmdoc daily website falls under University of Illinois copyright and intellectual property rights. For a detailed statement, please see the University of Illinois Copyright Information and Policies here.