


How Well Can Banker’s Predict Future Farm Loan Volumes? Evidence from the Chicago Fed
Farmers rely on external debt capital to finance their capital base, to conduct marketing and production activities, and to provide a valuable source of liquidity in responding to risks. As a result, the availability of loans is critical to the financial health of the agricultural sector. This article explores the viability of future loan volume expectations of commercial lenders to predict loan volume levels based on survey data collected by the Federal Reserve Bank of Chicago.
Federal Reserve Bank of Chicago’s Land Values and Credit Conditions Survey
The Federal Reserve Bank of Chicago serves the Seventh Federal Reserve District which includes the Northern portions of Illinois and Indiana, Southern Wisconsin, the Lower Peninsula of Michigan, and the entire state of Iowa. The bank conducts a quarterly survey of agricultural bankers to monitor credit conditions and other key drivers of the agricultural sector across the region. The sample includes member banks at which farm loans represented 25 percent or more of total loans as of June 1972 (a 10 percent standard is used for banks in the state of Michigan), and the sample has undergone periodic review. The latest survey results were based on the responses of about 450 banks.
Each quarter, the debt collectors report whether the volume of farm loans was lower, higher, or the same as the same quarter of the previous year (Table C.1 Agricultural Finance Databook). The Agricultural Finance Databook reports the aggregated findings as the share of responses in each category. The categorical responses are typically summarized using a diffusion index calculated by subtracting the percent of agricultural bankers reporting lower loan volumes from the percent reporting higher loan volumes (i.e., the net positive responses) and then adding 100. As a result, a diffusion index of 100 suggests no change in agricultural loan volumes. An index above 100 suggests increasing loan volumes, and an index below 100 implies declining loan volumes. The diffusion index depicted in Figure 1 suggests that bankers typically observe increasing loan volumes with some exceptions, most notably between the first quarter of 2011 and the third quarter of 2013.

In addition, the bankers also provide opinions on whether the volume of farm loans in the next quarter is expected to be lower, higher, or the same as the same quarter of the previous year (Table C.2 Agricultural Finance Databook). A diffusion index for the expected loan volume is plotted along with the observed loan volume in Figure 2. The figure suggests that the expected diffusion index provides a leading indicator of the general patterns of the observed farm loan volume.

How good are bankers’ predictions of future loan demand?
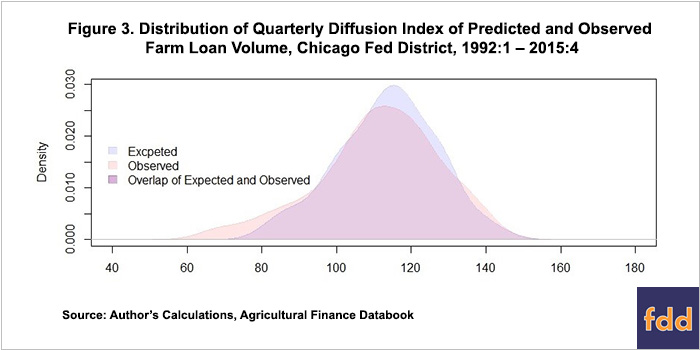
Previous research has demonstrated that the Federal Reserve Bank of Kansas City’s Survey of Agricultural Credit Conditions, a similar agricultural banker survey, provides useful predictions of farm loan repayment rates and collateral requirements (Briggeman and Zakrzewicz, 2009). The distribution of the observed and predicted diffusion indexes for loan volume from the Chicago Fed survey are plotted in Figure 3. The two distributions overlap to a large degree which suggests that banker’s predictions closely mirror observed loan volume patterns. However, the distribution of the two diffusion indexes also suggest that bankers may systematically under predict decreasing loan volumes. That is, the greatest difference between the two loan volumes is found for diffusion index values less than 100. The diffusion index of predicted farm loan volumes has a slightly higher mean (113.52 compared to 111.20) and slightly lower standard deviation (13.35 compared to 16.12) than the diffusion index of observed loan volumes. However, the differences are not statistically significant at conventional levels (? ? 0.05). In other words, there is little difference, statistically, between the two distributions.
We can also examine the predictive ability of banker’s expected loan demand using simple regression analysis. We estimate a simple regression model that examines the relationship between observed loan demand (at quarter t) with the related diffusion index of expected loan volume (collected in quarter t-1).

The estimated slope coefficient (beta = 0.980) is close to one which suggests that the banker’s expectations are a good predictor of observed loan volume. This relationship can also be observed in the regression line plotted in Figure 4 along with the observed and predicted diffusion indexes. Further, the R-squared for the simple regression suggests that predicted loan volumes explain approximately 66.0% of the variation in observed loan volumes.

Implications for Understanding Future Loan Volume
Given that the Chicago Fed Land Values and Credit Conditions Survey is a valuable predictor of agricultural loan volumes and future credit conditions in the 7th District, what do the current survey results suggest about future loan demand? The most recent survey results reported in the Agricultural Finance Databook suggest that 13% of respondents expect lower loan volumes in the 1st quarter of 2016 and 52% expect higher loan volumes. This yields a diffusion index value of 139, which implies increasing farm loan volume compared to the same quarter of 2015.
The Agricultural Finance Databook also reports the banker’s expected farm loan volume by the purpose of the loan. While the observation data to examine the predictive ability of these expectations are not available, they do give a strong indication of banker’s expected loan volume for each category. The diffusion indexes suggest an increasing loan volume for operating loans (165), yet bankers expect reductions in loan volumes for feeder cattle (72), dairy (96), crop storage (55), farm machinery (36), and farm real estate (68).
Disclaimer: The views expressed are those of the authors and should not be attributed to ERS or USDA.
References
Federal Reserve Bank of Kansas City. Agricultural Finance Databook, Accessed May 4, 2016. https://www.kansascityfed.org/research/indicatorsdata/agfinancedatabook
Briggeman, B.C. and C. Zakrzewicz. "Can the Ag Credit Survey Predict National Credit Conditions?" Economic Review, Federal Reserve Bank of Kansas City. https://www.kansascityfed.org/publicat/econrev/pdf/09q4Briggeman.pdf
Disclaimer: We request all readers, electronic media and others follow our citation guidelines when re-posting articles from farmdoc daily. Guidelines are available here. The farmdoc daily website falls under University of Illinois copyright and intellectual property rights. For a detailed statement, please see the University of Illinois Copyright Information and Policies here.