Crop Insurance Performance in 2015: Low Losses Predominate
Reasonably complete 2015 crop insurance payment information now exists, allowing for an assessment of loss performance in 2015. Overall, losses across all U.S. policies were below average. Corn, soybeans, and cotton had low losses. Rice and peanuts had high losses. Most of the western corn-belt had low losses. In the corn-belt, large losses occurred in Missouri and in a band of counties in northeast Illinois, northern Indiana, and northwest Ohio. Over the past decade, loss ratios averaged less than total payments.
Overall Crop Insurance Performance
The Risk Management Agency (RMA), an agency of the U.S. Department of Agriculture, administers Federally regulated and subsidized crop insurance programs. Data from RMA contained in the Summary of Business is reported in this article. At this point, 2015 crop insurance payment data are relatively complete with one exception. Cotton STAX payments are not included in the Summary of Business database. The inclusion of cotton STAX losses, along with late entering data, will marginally increase overall 2015 loss ratios presented in this article.
Loss ratios – which equal crop insurance payments divided by total premium – are useful measures for evaluating the actuarial performance of crop insurance. RMA has a statutory goal of maintaining a loss ratio near 1.00 over time, meaning that insurance payments should be near total premium. Loss ratios below 1.00 mean that payments were less than total premium. Conversely, loss ratios above 1.00 mean that payments exceeded total premium.
In 2015, the loss ratio for the entire crop insurance program was .65 (see Figure 1), well below the 1.0 benchmark. The 2015 loss ratio was below the average loss ratio between 2010 through 2015 of .97. The 2015 ratio also was below the ten-year loss ratio from 2006 through 2015 of .88.

Over time, RMA has maintained a loss ratio below 1.0, meaning that payments have been below total premiums. Loss ratios have varied over time, reflecting the yield and price uncertainty that exists in agriculture. For instance, the overall loss ratio was 1.56 in 2012, the year that a large drought impacted production in the Midwest. More often, payments do not exceed premium. From 2000 to 2015, the overall loss ratio was below 1.0 in 75% of the years. This type of performance likely will continue into the future: Loss ratios will be below 1.0 in most years with large loss years occurring sporadically.
Performance by Crop
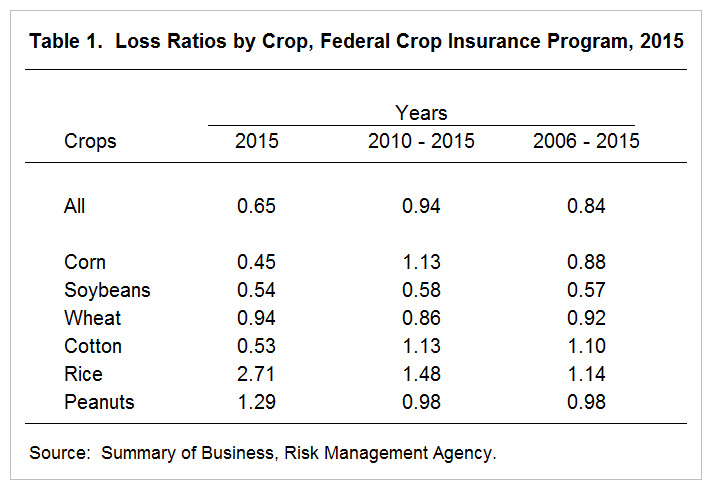
Loss performance varied by crop in 2015. Corn, soybeans, and cotton had low loss ratios for 2015: .45 for corn, .54 for soybeans, and .53 for cotton (see Table 1). The loss ratio for cotton will increase with the inclusion of STAX losses. A .45 loss ratio on STAX would increase cotton’s loss ratio to .60. Wheat had a loss ratio of .55. Loss ratios were above 1.0 for rice and peanuts: 2.71 for rice and 1.29 for peanuts.

In the past ten years, most of the crops have had loss ratios below 1.0. Between 2006 and 2015, crops with loss ratios between 1.0 include corn (.88), soybeans (.57), wheat (.92), and peanuts (.98). Cotton and rice had loss ratios that averaged above1.0 for the last ten years: 1.10 for cotton and 1.14 for rice.
Loss Performance Across Counties
Figure 2 shows a map with loss ratios indicated for each county. These 2015 loss ratios are aggregated across crops and are weighted by total premium. Counties within the corn-belt had mixed losses. Most counties in the western corn-belt in Iowa, Minnesota, Wisconsin, North Dakota, eastern South Dakota, and eastern Nebraska has loss ratios below .50. Several areas in Missouri and the eastern corn-belt had high loss ratios. Counties in Missouri and in a band of counties from northeast Illinois, through northern Indiana, and ending in northwest Ohio had loss ratios above 1.5. These areas had low yields due to an extremely wet spring and early summer.

Outside the Midwest, there were large geographical areas with low losses. The eastern seaboard from Virginia north to Maine, Florida, Alabama and Georgia, much of the great Plans, and western Washington and Oregon had loss ratios below .5. High loss ratios occurred in North and South Carolina, southern Texas, California and eastern Washington and Oregon.
Summary
Overall, 2015 was a low loss year in aggregate. As a result, most of the counties within the United States had low losses. However, as is typically the case, some areas had high losses.
References
USDA Risk Management Agency. "Summary of Business Reports and Data." Accessed May 17, 2016. http://www.rma.usda.gov/data/sob.html
Disclaimer: We request all readers, electronic media and others follow our citation guidelines when re-posting articles from farmdoc daily. Guidelines are available here. The farmdoc daily website falls under University of Illinois copyright and intellectual property rights. For a detailed statement, please see the University of Illinois Copyright Information and Policies here.


