Landowner’s Adjusted Net-Share Rent as a Percent of Crop Returns, a Historic Review
Over time, more farmland leases in Illinois have been shifting from traditional crop share leases to cash leases. In addition, there has been some increase in flexible or variable rent cash leases from fixed cash leases. Variable cash rent leases have terms that tie the cash rent amount the operator pays for the year to some measure of the actual economic returns for the year. How the actual cash rent is determined varies from one variable lease to another. One type of variable cash lease bases the rent on a percentage of the actual crop returns for the year.
Crop returns can be calculated in different ways but a common approach is to use actual yields times an average crop price. The average price may be an average price at a local elevator over a certain period that the grain is traditionally marketed. Payments from government farm programs may also be included in crop returns.
One of the factors in this type of lease that needs to be negotiated is what percentage of the crop returns should be used in determining the cash rent amount. Historical studies have concluded that this percentage maybe as low as 15 to 20 percent on lower productive soils to as high as 35 to 40 percent on the highest productive soils. In this article, we use Illinois Farm Business Farm Management (FBFM) record data from 2007 through 2015 and projections for 2016 to calculate landowner’s adjusted net-share rent and then compare this figure to crop returns to determine what this percentage has been under typical crop share arrangements. It would seem that this information would be useful in negotiating an appropriate percent of crop returns to be paid for cash rent.
It is important to have an understanding of how landowner’s adjusted net-share rent is calculated. Landowner’s adjusted net-share rent is calculated by taking the share of the crop returns the landowner would be receiving under a typical crop share lease for the area and subtracting off the landowner’s share of shared expenses they would be paying under the crop share lease. For example, in a typical 50/50 crop share lease, the landowner would be receiving 50 percent of the crop proceeds and government payments, if any, and paying 50 percent of the crop expenses. Shared crop expenses normally would include fertilizer, seed, chemicals, drying, storage and crop insurance. Note the shared crop expenses do not include certain expenses that the landowner would be paying whether the lease is a crop share or cash lease, namely real estate taxes and possible some insurance.
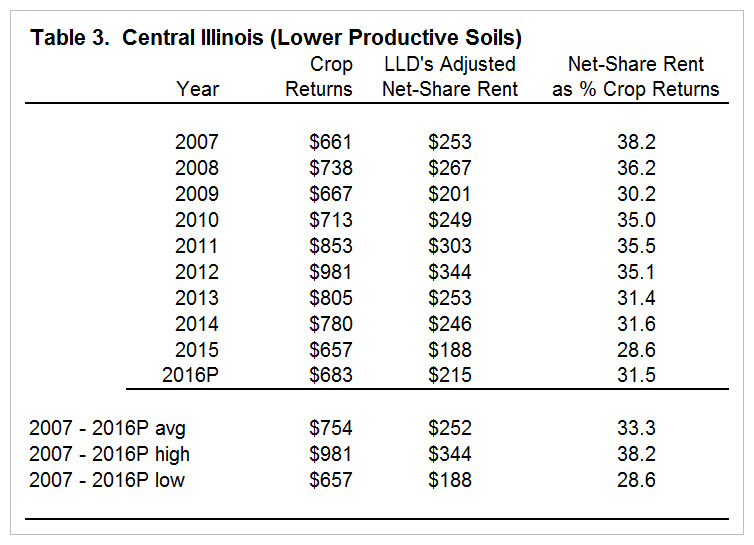
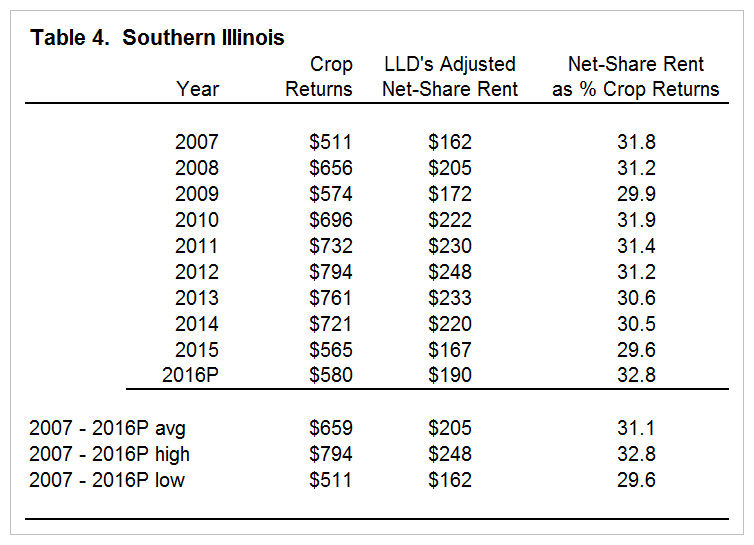
Tables 1 through 4 below list crop returns and landowner’s adjusted net-share rent on a per acre basis for 2007 through 2015 and projections for 2016 for four geographic regions in Illinois. The tables also include the net-share rent amount as a percentage of crop returns.


At the bottom of each table are the averages for the 2007 through 2016 projections along with the high and low figure for the 10-year period. The average net-share rent as a percent of crop returns for the 10-year period are remarkable close for the four regions, 33.5% for northern Illinois, 33.6% for central Illinois with the higher productive soils, 33.3% for central Illinois with the lower productive soils and 31.1% for southern Illinois. The range between the highest and lowest percent of gross returns was 4.6 to 5.0 percentage points for northern and central Illinois but only 1.7 percentage points for southern Illinois.
It is interesting to note that the highest crop return per acre for all four regions was in 2012 but this was not the highest percent crop returns for any of the four areas. For northern and central Illinois, the highest net-share rent as a percentage of crop returns occurred in 2007. For southern Illinois, it is the projected percentage for 2016. Even though crop returns and landowner’s adjusted net-share rent were significantly higher in 2012 than 2007, the net-share rent figure did not increase at the same rate as crop returns due to higher costs resulting in a lower crop return percentage in 2012 compared to 2007. The lowest net-share rent as a percent of crop returns occurred in 2015 for central and southern Illinois and in 2009 for northern Illinois.

The other general trend that is occurring during the 2007 through 2015 time-period is that this percentage has been trending downward, especially for northern and central Illinois. The 2009 net-share rent as a percentage of crop returns was significantly lower than the two years before (2007 and 2008) and the three years following (2010 through 2012) as a result of lower crop returns due to lower corn yields, lower grain prices and significantly higher fertilizer, seed and drying costs.
Projections for 2016 indicate that the net-share rent as a percent of crop returns will increase some as compared to 2015. Actual farm data will confirm this or not.
A set percentage of crop returns is the factor that determines the amount of cash rent paid per acre by some variable cash rent leases. Historical and more recent studies indicate for the most productive land in Illinois an appropriate percentage of crop returns would be in the mid to upper thirty percent range. For lower productive soils an appropriate percentage would be in the low thirty or high twenty percent range. This is based on a return to landowners similar to what they would be earning on a “typical” crop share lease for the area. These percentages might be adjusted up or down based on other factors and goals of the landowner and operator. It is also suggested that these percentages should be reviewed from time to time as changes in crop returns and expenses affect returns to farmland.
The author would like to acknowledge that data used in this study comes from the local Farm Business Farm Management (FBFM) Associations across the State of Illinois. Without their cooperation, information as comprehensive and accurate as this would not be available for educational purposes. FBFM, which consists of 5,700 plus farmers and 62 professional field staff, is a not-for-profit organization available to all farm operators in Illinois. FBFM field staff provide on-farm counsel with computerized recordkeeping, farm financial management, business entity planning and income tax management. For more information, please contact the State FBFM Office located at the University of Illinois Department of Agricultural and Consumer Economics at 217-333-5511 or visit the FBFM website at www.fbfm.org.
Disclaimer: We request all readers, electronic media and others follow our citation guidelines when re-posting articles from farmdoc daily. Guidelines are available here. The farmdoc daily website falls under University of Illinois copyright and intellectual property rights. For a detailed statement, please see the University of Illinois Copyright Information and Policies here.


