Fixed Cash Rental Rates Diverge from Farm Earning Since 2013
In this article, cash rents on professionally managed farmland are compared to landlord returns derived from share rent leases. On high-productivity farmland in central Illinois, professionally-managed cash rents and share lease returns followed each other closely up to 2012. Since 2012, share rent returns have trended downward. Professionally managed rents have lagged the declines in share-rent returns.
Background
Fixed cash rent leases set a fixed amount of rent that does not vary with prices or yields. According to a survey of members of the Illinois Society of Professional Farm Managers and Rural Appraisers (ISPFMRA), approximately 31 percent of all their leases are fixed cash rent leases. An advantage for the landowner of the fixed cash rent lease is that risk is reduced in that they are not subject to crop yield and price variability. Another advantage is that the time and management that the landowner needs to provide is reduced due to the fact they are not marketing grain or paying their share of the crop inputs.
A disadvantage of a fixed cash rent lease is setting the correct cash rent amount. Most cash rent leases are negotiated in the fall ahead of the crop year when crop yields and crop prices are very uncertain. This is more of an issue in times of higher farm income volatility, as has been the case in the last 10 years. Incomes on Illinois grain farms increased significantly from 2007 through 2012, except for 2009, and have declined considerably since 2012. Often, cash rent levels lag changes in income levels.
Cash Rent to Share Rent Level Comparison
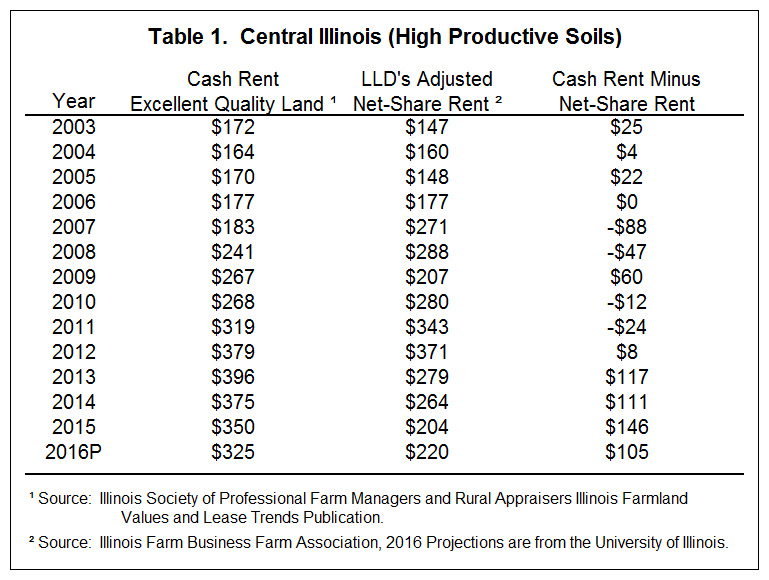
Table 1 shows cash rent and adjusted net-share rents. Cash rents are reported in the second column and come from the Illinois Farmland Value and Leasing booklet of the Illinois Society of Professional Farm Managers and Rural Appraisers (ISPFMRA). Average cash rents are used for excellent quality farmland, land that would typically average 190 bushels per acre of corn or better. ISPFMRA summary information is divided into thirds and an average is calculated for each third. The mid-point of the middle third is used for the average cash rent figure in this analysis. As can be seen in Table 1, the lowest cash rent level of $164 per acre occurred in 2004. Cash rents then increased to $396 per acre in 2013. Since 2013, cash rents have fallen each year, decreasing to a projected level of $325 per acre in 2016.

Data from the Illinois Farm Business Farm Management Association (FBFM) records is used to arrive at landlord’s adjusted net-share rents for central Illinois grain farms with highly productive soils, land with corn yields typically above 190 bushels per acre. Landowner’s adjusted net-share rent equals the return a landlord receives from a share rent. Under a typical 50/50 crop share lease, the landowner receives 50 percent of the crop proceeds and government payments, and pays 50 percent of the following expenses: fertilizer, seed, chemicals, drying, storage and crop insurance. Cash rents and adjusted share rent returns are comparable as they are both a gross return to the land. From this return, landowners must pay real estate and other land ownership costs.
Adjusted net-share rents are highly correlated to returns farmers receive from farmland. One characteristic of share rents is that they adjust up or down to changes in yields, prices, and crop costs. As a result, net-share rents change quickly to changing farming conditions.
Like cash rents, adjusted net-share rents exhibit time trends. Adjusted net-share rents increased from $147 per acre in 2003 to $371 per acre in 2012. Share rents have been declining since 2012. In 2015, adjusted share rent returns equaled $204 per acre.
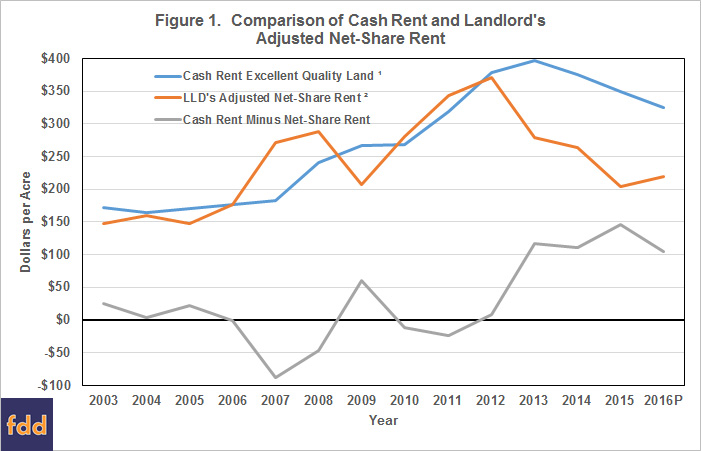
Figure 1 illustrates this data in a graphical form. The lower line in the graph is cash rent minus the net-share rent amount. Where the line is above $0 indicates where cash rent is more than the adjusted net-share rent figure. The opposite is true when the line is below $0.

From 2003 to 2006, cash rents were equal to or slightly above adjusted net-share rents. Between 2007 through 2012, farm incomes increased resulting in increases in adjusted net -share rents. Cash rents on professionally managed farmland followed farm income and adjusted net-share rents to higher levels.
Since 2013, farm incomes have been decreasing, resulting in decreasing adjusted share rent rents. Cash rents have lagged the decreases in adjusted net-share rent decreases. Cash rents continued to go up in 2013 while net-share rents decreased. Cash rents have been higher than adjusted net-share rents in each year since 2013: $117 per acre higher in 2013, $111 in 2014, $136 in 2015, and $105 in 2106.
Observations
Cash rents lag changes in net-share rents, particularly when farm incomes are decreasing. It also should be pointed out that the cash rent data is from professional managed farms and one would expect these rents would adjust quicker than rents on non-professionally managed farms. An analysis of average cash rents would show that average cash rents lagged the farm income increases in the 2006 through 2012 period.
The recent time of lower farm incomes has led to lags in cash rent decreases. It is difficult for landowners to lower cash rents. Lagging cash rents obviously places farmers in difficult positons during low income years.
The author would like to acknowledge that data used in this study comes from the local Farm Business Farm Management (FBFM) Associations across the State of Illinois. Without their cooperation, information as comprehensive and accurate as this would not be available for educational purposes. FBFM, which consists of 5,700 plus farmers and 62 professional field staff, is a not-for-profit organization available to all farm operators in Illinois. FBFM field staff provide on-farm counsel with computerized recordkeeping, farm financial management, business entity planning and income tax management. For more information, please contact the State FBFM Office located at the University of Illinois Department of Agricultural and Consumer Economics at 217-333-5511 or visit the FBFM website at www.fbfm.org.
Disclaimer: We request all readers, electronic media and others follow our citation guidelines when re-posting articles from farmdoc daily. Guidelines are available here. The farmdoc daily website falls under University of Illinois copyright and intellectual property rights. For a detailed statement, please see the University of Illinois Copyright Information and Policies here.


