Estimated 2016 ARC-CO Payments
On February 23rd, the National Agricultural Statistical Service (NASS) released county yields for the 2016 crop year. With these yield estimates, fairly accurate estimates of 2016 Agricultural Risk Coverage at the county level (ARC-CO) payments can be obtained. We present maps showing estimated payments per base acre for corn, soybeans, and wheat. Also shown are maps giving 2016 county yields relative to benchmark yields. A table showing estimated payments per county in Illinois also is presented.
Procedures
Payments for 2016 are still estimates and will vary from those presented here for the following reasons:
- Farm Service Agency (FSA) uses different yields than NASS when calculating ARC-CO payments. Where NASS data is available, the NASS yield generally will be higher than the yield used by FSA. As a result, estimated payments presented here should be viewed as conservative.
- Market Year Average (MYA) prices are not known because the marketing year does not end until August for corn and soybeans and May for Wheat. MYA estimates used in these projections are $3.50 per bushel for corn, $9.60 per bushel for soybean, and $3.85 per bushel for wheat. Ending MYA prices can vary from these estimates.
- Sequestration amounts may differ from those used here. The ARC-CO payments estimated here use the 6.8% sequestration reduction applied to the 2014 and 2015 payments. The sequestration amount may differ from the 6.8% estimate.
The following maps report payments on a per base acre basis. Payment acres are .85 of base acres and the .85 adjustment has been applied to payments presented in the following maps and table.
ARC-CO is a revenue-based program where revenue equals the MYA price times the county yield. Variation in payments across counties occurs because of variations in county yields from benchmark yields. Those areas with county yields substantial above benchmark yields will have no ARC-CO payments. ARC-CO payments increase as the county yield falls relative to the benchmark yield, eventually reaching the cap equal to ten percent of benchmark revenue.
Corn
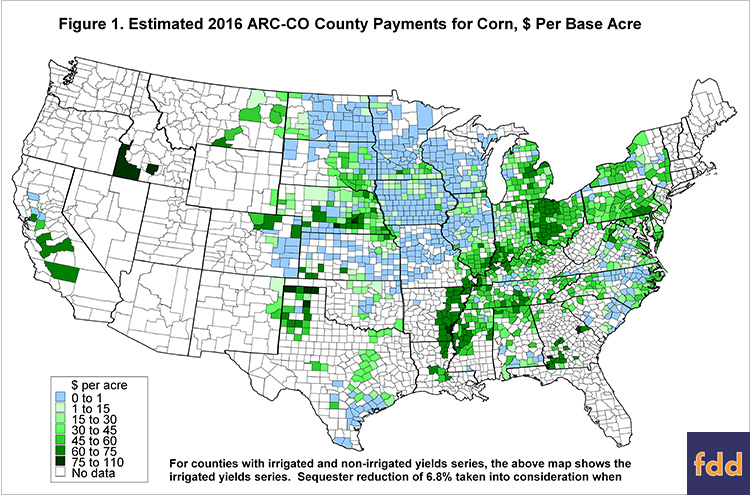
Large payments are projected to occur in the eastern United States, with over $60 per base acre projected for many counties in central and western Ohio and central Michigan (see Figure 1). Large payments follow the Ohio River through Indiana, Illinois, and Kentucky, and proceed down the Mississippi. Counties in the bootheel of Missouri, Arkansas, and Mississippi are projected to have large payments. Some counties in South Dakota, Nebraska, and the panhandle of Texas are projected to get larger payments.

Many counties in Illinois, Iowa, Missouri, Wisconsin, Minnesota, and North Dakota are projected not to receive payments.
Those counties not receiving payments have 2016 county yields that are projected to be at least 1.17 higher than the benchmark yields. The 1.17 comes from a comparison of the 86% ARC-CO guarantee to the relative decrease in the MYA price relative to the benchmark price. The $3.50 MYA price is .72 of the $4.79 benchmark price for 2016 (.72 = 3.50/4.79). To not trigger a payment, 2016 actual yields must be 1.17 higher than the benchmark yield (1.17 = .86 / .73).
In Figure 2, counties with the two darker shades of blue have projected yields that are at least 1.17 times the benchmark yield. As can be seen, lower yields predominate in areas projected to receive county payments including the eastern United States, southern United States, and along the Mississippi River.
Soybeans
Sizable ARC-CO payments occur in some counties in eastern seaboard states: New York, Pennsylvania, Maryland, Delaware, Virginia, and North Carolina. Payments also occur in Louisiana, Mississippi, Alabama, and Tennessee (see Figure 3). Most counties in the Midwest are not projected to receive a payment.

The 2016 MYA price used in projections is $9.60 per bushel, 19% below the benchmark price of $11.86. To receive a payment, the 2016 county yield must be higher than .92 of the benchmark yield (see the corn discussion for how this factor is determined. Most counties in the Midwest had exception yields, resulting in county yields significantly above benchmark yields (see Figure 4). As a result, ARC-CO is not projected to make payments in the Midwest. Those areas with lower yields are projected to receive payments.
Wheat
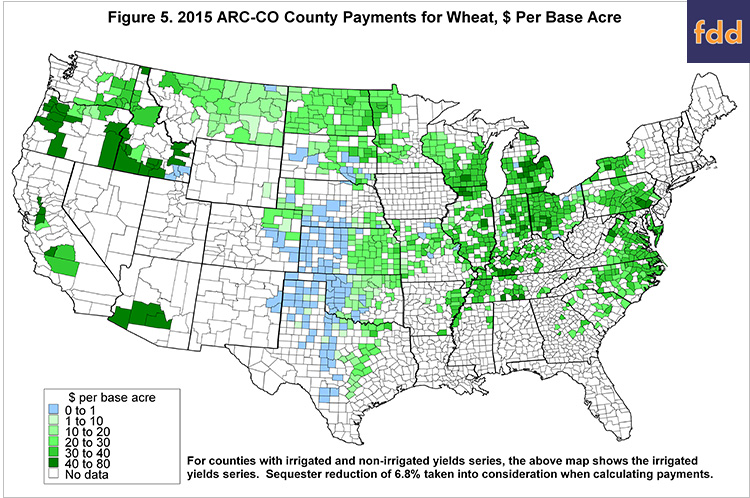
Many counties in the United States are projected to have ARC-CO payments for wheat (see Figure 5). Exceptions are the heart of the wheat belt in Nebraska, Kansas, Oklahoma and Texas.

The 2016 projected price is 3.85, well below the benchmark price of $6.70. Those counties not having ARC-CO payments have 2016 county yields that are 1.50 higher than the benchmark yield (see Figure 6) Obviously, these areas having exceptional yields are in the areas where no ARC-CO payments are occurring.
Illinois Payments
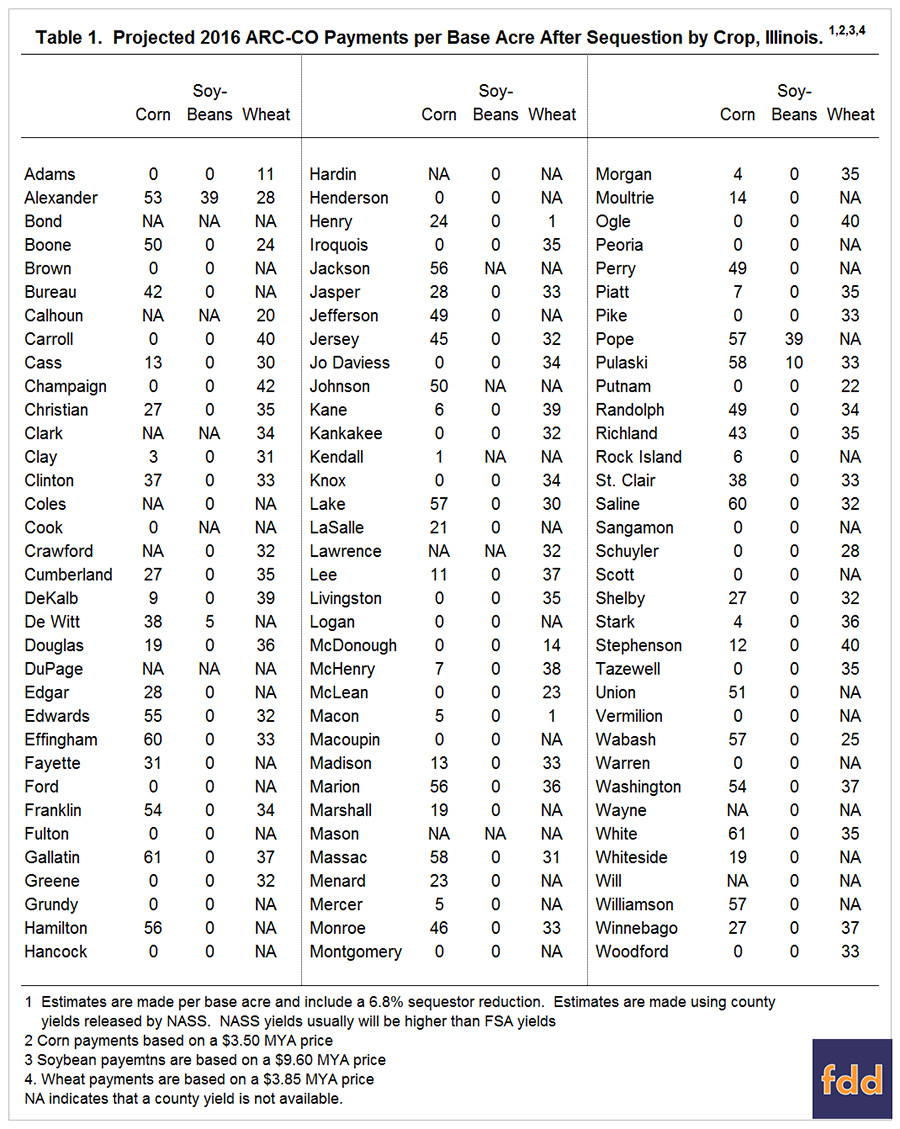
Estimated corn, soybeans, and wheat payments for Illinois counties are shown in Table 1.

Summary
Because final yields and prices are not yet known, actual ARC-CO payments are likely to vary from the estimates shown in this article. The final yields used in calculating payments can differ from the yields released by NASS, and will also cover additional counties in the US. The final MYA price levels for corn and soybeans will not be known with certainty until the marketing year ends in August. However, where NASS yields are available, estimates for the 2016 ARC-CO payment levels can be helpful for planning purposes.
Disclaimer: We request all readers, electronic media and others follow our citation guidelines when re-posting articles from farmdoc daily. Guidelines are available here. The farmdoc daily website falls under University of Illinois copyright and intellectual property rights. For a detailed statement, please see the University of Illinois Copyright Information and Policies here.


