


Illinois Farmland Values in Context
Each year, the Illinois Society of Professional Farm Managers and Rural Appraisers collects representative sales data from all across the state of Illinois, divided into 10 regions based on prominent agricultural cropping practices, soil type groupings, and management regions. In addition to land values from sales records, the ISPFMRA also collects information about lease rates, lease types, numbers of sales, and other information that helps to provide a more complete understanding of market conditions and trends in local markets. The farmdoc daily article from March 27, 2018 details the survey also completed by the Society to assess farmland lease rate expectations. In addition, USDA also collects aggregated data that are also helpful for placing local results into a larger context.
In the following, we present some aggregated information from the Illinois survey and compare 2017 results to prior periods and present historic measures of valuation with rates of change, and finally identify some factors affecting future values of farmland. While space prevents a more complete presentation of details by region, county, or by productivity class, those interested in a more detailed breakdown can purchase a copy of the complete
2018 booklet at the ISPFMRA website: http://www.ispfmra.org/2018/03/01/order-now-2018-land-values-report/
Overall Farmland Value Trends
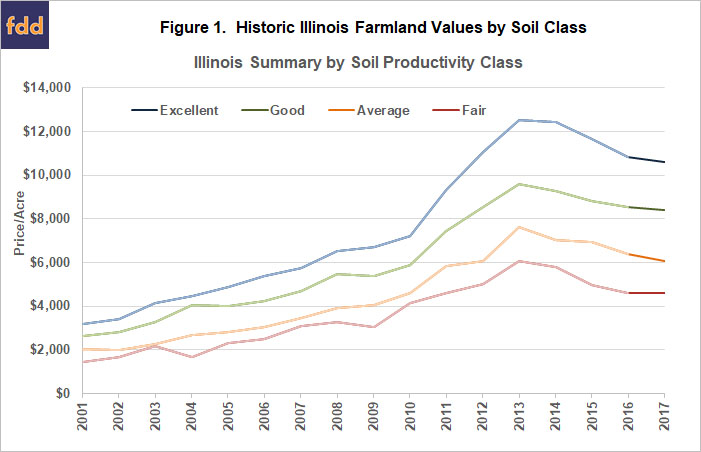
Figure 1 shows summary Illinois farmland price information from 2001 to the end of 2017 grouped by soil productivity. While the different valuation levels correspond to differences in yield capacity, the pattern through time that emerges is for a reasonably constant growth rate in values from 2001 through 2010, then accelerating increases in values through 2013. After 2013, land values moderated rather rapidly for a few years but now seem to be tapering to what many view as a “soft bottom”. Several regions reported minor increases in some categories, and some minor decreases in others, but overall seem to be approaching a “flatline” period in terms of price change.
In Table 1, annual average prices and continuously compounded annual growth rates for selected intervals are provided to help better understand the long-term performance of each class. Farmland owners/investors tend to have reasonably long horizons, so it is important to consider the performance through time in addition to recent price change information.
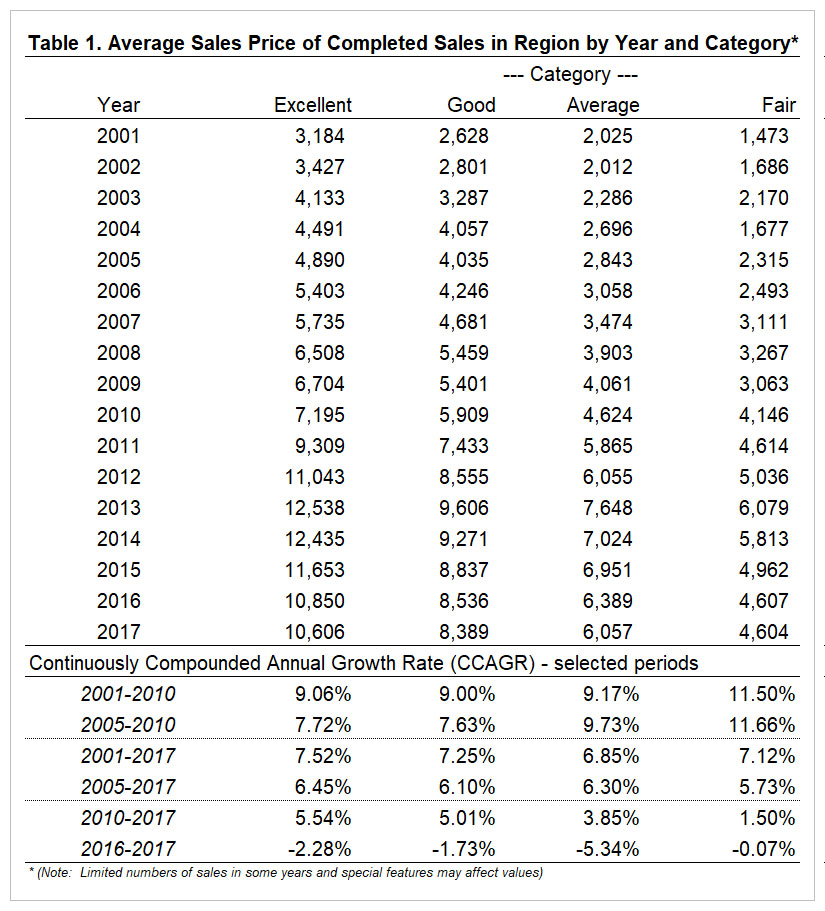
As shown in the table (top row of lower section), from 2001-2010 the annual growth rates in the value of Illinois farmland averaged more than 9% per year for each soil class. From 2010 to 2017 (fifth row of lower section) the average is still positive in each case at around 5% for Excellent and Good quality soils despite the recent declines from 2013 to present in most cases. Interestingly, over the entire period from 2001 to 2017 (third row of lower section), the average growth in farmland values has been around or slight greater than 7% per year. The values provided here are from sales that the members of the ISPFMRA judged to be representative of all the sales by region and class, so sometimes exclude irregular sales, hobby farms, or other off-market transfers. Note also that that annual income generated by farmland is not included in these figures, instead representing only capital gains rates.
Does the Farmland Market Make Sense?
One way to understand farmland prices is to consider what a rational investor would be willing to pay for the income that is expected to be generated by the asset, relative to the riskiness of the income stream over time. A commonly used means to summarize this relationship is to capitalize the future income by a risk-adjusted discount rate. It is similar in concept to comparing a current deposit in an interest earning account to the stream of payments that could be withdrawn from that account over time. While this relationship is imprecise, it is worth examining how it has behaved through time. Figure 2 contains a plot through time of the ten-year constant maturity interest rate or CMT-10, and compares that to the ratio of cash rent to underlying value of farmland based on aggregate USDA survey data. Two periods are interesting to focus on. First, during the period from about 1978 to 1984, there was a stark departure between the CMT-10 and the rent-to-value ratios of farmland in Iowa, Illinois, and Indiana suggesting that land returns were out of line with their capitalized values. Near the end of the period shown, the CMT-10 is actually below the rent-to-value ratios, although the movements in the CMT 10 since the end of 2017 have moved them back into a similar range.
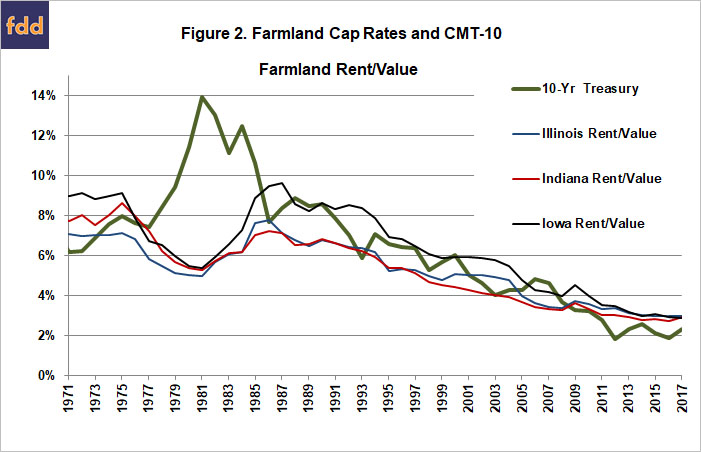
This relationship in a sense simply says that farmland markets did not view the rapid increases in income prior to 2013 as being totally permanent (as was proven to be the case), or did not view the low levels of the CMT-10 as a proxy for the capitalization rate as being permanent (as has also proven to be the case). In any case, the farmland market in some sense by definition of a “market” reflects the best information available to buyers and sellers, and does not display information that suggests major disconnections from fundamentals as was the case in the 1980s.
An upcoming farmdoc daily article (Zulauf et. al) further breaks down price changes by sources most nearly attributable to changes in income and to changes in discount rates through time to provide a more complete understanding of the causes of changing farmland values through time.
References
Illinois Society of Professional Farm Managers and Rural Appraisers (ISPFMRA). 2018 Land Values Report. Link to order: http://www.ispfmra.org/2018/03/01/order-now-2018-land-values-report/
Schnitkey, G., and B. Sherrick. "Cash Rents on Professionally Managed Farmland in 2018 and 2019." farmdoc daily (8):53, Department of Agricultural and Consumer Economics, University of Illinois at Urbana-Champaign, March 27, 2018.
Disclaimer: We request all readers, electronic media and others follow our citation guidelines when re-posting articles from farmdoc daily. Guidelines are available here. The farmdoc daily website falls under University of Illinois copyright and intellectual property rights. For a detailed statement, please see the University of Illinois Copyright Information and Policies here.