Prospects for Timely Planting of the 2018 Soybean Crop
In a farmdoc daily article on April 25, 2018, we examined the prospects for timely planting of the U.S. corn crop in 2018. Our computations indicated that there was still sufficient time remaining to plant the U.S. corn crop in a timely manner (before May 20). However, the same computations also indicated that the margin for error was slim due to the late start of the season. We concluded that there was a reasonable chance of late corn planting in 2018 to be 5 to 10 percent above average. Planting date considerations for soybeans are equally important but do not seem to attract as much attention as in the case of corn. Prospects for completing planting of the 2018 soybean crop in a timely fashion, like corn, depend on four factors: 1) the percentage of the crop already planted; 2) the beginning date for a significant late planting penalty for soybean yields; 3) the number of days suitable for fieldwork needed to plant the soybean crop; and 4) the total number of days suitable for planting expected before the beginning date of a significant late planting yield penalty. The purpose of this article is to assess each of these factors and project the timeliness of planting the 2018 U.S. soybean crop. We also consider the impact of the expected timeliness on projections of the U.S. average soybean yield for 2018.
Analysis
As outlined above, the first factor that will determine the prospects for timely planting of the U.S. soybean crop is the percentage of the crop already planted. The USDA’s weekly Crop Progress report indicated that 5 percent of the soybean acreage in 18 major producing states was planted as of April 29, compared to 9 percent last year and a five-year average of 5 percent. Planting in the Delta region has been delayed compared to last year due to wet conditions. But, overall, soybean planting progress for this date in late April is near normal.
The second factor that will determine the prospects for timely planting of the U.S. soybean crop is the beginning date for a significant late planting penalty for yields. There is not complete agreement on the optimum planting window for maximizing soybean yields or the date when late planting begins to impose a substantial yield penalty. Both the optimum window and cutoff date for a significant late planting penalty certainly varies by geographic location. For market analysis purposes, however, it is useful to identify one date for the end of the optimum window that can be applied to the U.S. soybean crop. Acreage planted after that date would be considered to be planted late and yield potential would be expected to be reduced as the percentage of the acreage planted late increases.
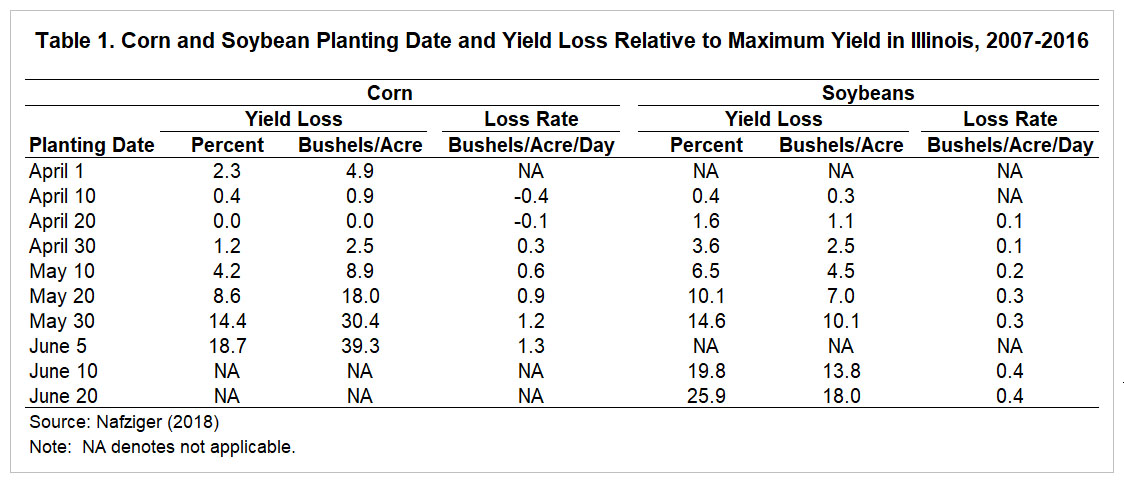
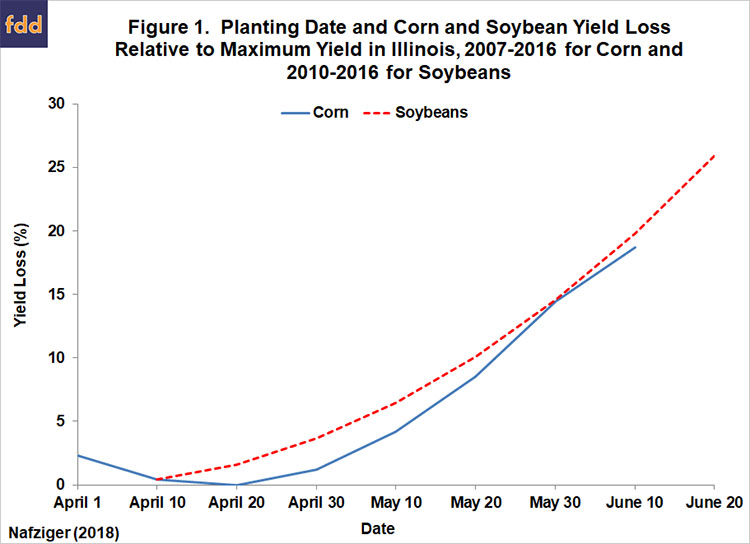
In order to set the late planting cutoff date, we review information generated from agronomic research relating planting date to soybean yields at the farm-level. We begin with information presented by Professor Emerson Nafziger in this March 23, 2017 article. It is typical of the information generated from agronomic research relating planting date to soybean yields. The yield response curve in that article is based on an average of central and northern Illinois sites over 2010 through 2016. Professor Nafziger kindly provided the data in the form of yield penalty by planting date shown in Table 1. For comparison, we also present the yield penalty by planting date for corn from last week’s farmdoc daily article (April 25, 2018). It is striking how similar the optimal planting windows in Illinois are for corn and soybeans. In both cases, yield loss is minimized by planting in mid- to late April. The yield penalties become increasingly large as planting is delayed after mid-May. For example, planting on or after May 20 results in a soybean yield loss of 14.6 percent, or 10.1 bushels per acre. The yield loss functions for corn and soybeans are plotted side-by-side in Figure 1, and this suggests that if not planted earlier, soybeans should be planted at the same time as corn in Illinois.


Results from soybean planting date research for different years and different locations vary throughout the U.S., but the evidence indicates planting on or before May 1 generally is associated with higher yield. De Bruin and Pederson (2008) provide widely-cited evidence in this regard for Iowa and also highlight earlier studies from the 1980s and 1990s that showed the benefits of earlier planting of soybeans in the upper Midwest of the U.S. Early planting benefits are not limited to the Midwest. A veritable revolution has occurred in the Mid-South and Delta regions in the last 25 years regarding soybean planting dates. For example, Orlowski and Irby (2017) show that the optimum window for planting irrigated soybeans in Mississippi is centered on late April to early May. In all cases for the Midwest and the South, yield penalties rise rapidly for planting dates after mid- to late May.
We have previously defined the beginning date for substantial late planting penalties on soybean yield in the U.S. to be June 10 from 1980-1985 and May 30 from 1986 forward (e.g., Irwin, Good, and Tannura, 2009). Since it has been so long since we have considered this issue we revisited it for the entire 1980-2017 period. In reviewing the data on U.S. soybean planting progress there was a clear break in behavior starting in the late 1990s, with substantially smaller amounts of late planting based on the traditional cutoff date of May 30. For this reason, we moved the cutoff date for to May 25 2000-2017. We also moved the cutoff data forward from June 10 to June 5 for 1980-1985 in order to obtain a stationary time-series on late planting. To summarize, the cutoff dates for our new soybean late planting variable for the U.S. are June 5 for 1980-1985, May 30 for 1986-1999, and May 25 for 2000-2017. One can certainly argue for an earlier cutoff date in later years, e.g., May 10, in the heart of the Corn Belt based on the data in Table 1 and other similar studies. However, we opt for the May 25 date in light of the large shift in soybean acreage in the far northern parts of the Corn Belt and the later date of the optimal planting windows in these areas. This also keeps the cutoff date for soybean late planting after the cutoff date for corn (May 20), consistent with the behavior of U.S. farmers in planting the two crops.
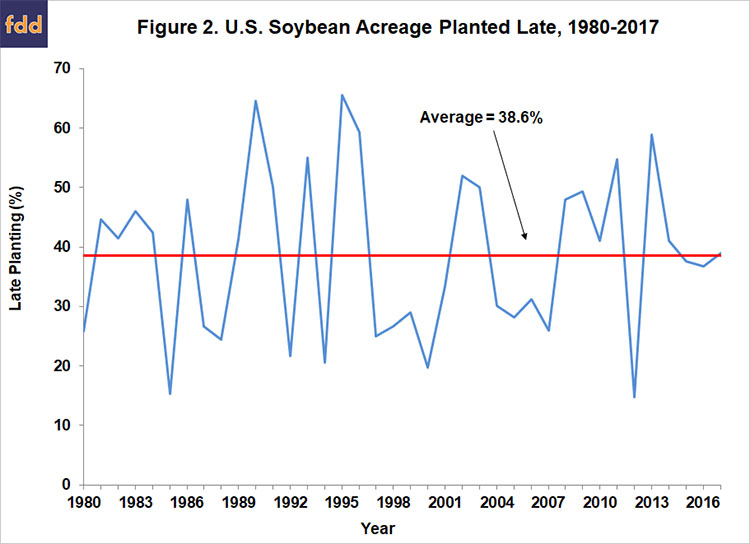
Figure 2 shows the percentage of soybeans planted late in the U.S. over 1980-2017 based on the cutoff dates specified above. On average, late planting based on this measure was 39 percent (rounded), with the bulk of the observations between about 20 and 50 percent. After sliding the cutoff date forward from June 5 to May 25, there is no evidence of a trend up or down over time in the late planting percentage. This provides a stable measure of late planting. The average level of late planting for soybeans, 39 percent, is much higher than for corn, 18 percent, which was reported in the farmdoc daily article of April 25. At least half of this difference can be attributed to double-crop planting of soybeans.

The third factor that will determine prospects for timely planting of the U.S. corn crop is the minimum number of days required to plant the U.S. corn crop. Note that this is simply stating the planting rate in terms of days rather than acres or percentage of the total planted acreage. We estimated the minimum number of days required to plant the U.S. corn crop in a farmdoc daily article on April 19, 2018. We repeated the same analysis for soybeans and found that producers in Illinois, Indiana, and Iowa needed a minimum of 16 suitable field days to plant the crop based on maximum daily rates of historical planting progress. This is two days longer than the estimated minimum number of field days we estimated that it would take to plant the U.S. corn crop. Assuming the three states are representative of the entire U.S., 16 days can also be used as an estimate of the minimum number of suitable field days needed to plant the entire U.S. soybean crop. It is important to emphasize that this is the absolute minimum number of days required to plant the crop because it assumes that peak rates of planting progress can be maintained for all 16 days.
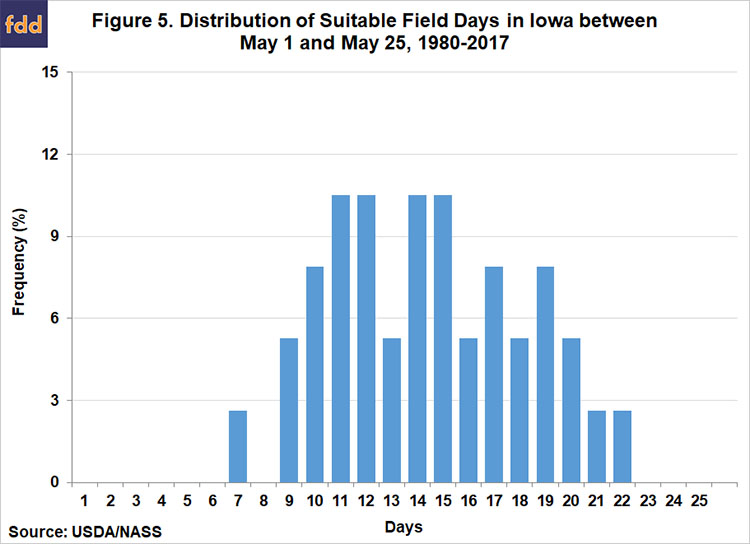
The fourth factor that will determine prospects for timely planting of the U.S. corn crop is the total number of days suitable for planting before the cutoff date for a significant late planting yield penalty, which we assume is now May 25. If we begin counting on May 1, this means there is a total of 25 days until the May 25 cutoff date is hit. We need to know the historical distribution of suitable field days over this 25-day period in order to determine the likelihood of obtaining different numbers of planting days. Figures 3-5 show the distribution of suitable field days between May 1 and May 25 over 1980-2017 in Illinois, Indiana, and Iowa, respectively. Over the 38-year period, the median number of suitable field days during this 25-day period was 14 days for Illinois and Iowa and 13 days for Indiana. In other words, farmers were normally able plant about half the time during this time window. The range of suitable days is very wide in each state, with a minimum of 5 days and a maximum of 22 days in Illinois, a minimum of 6 day and a maximum of 22 days in Indiana, and a minimum of 7 days and a maximum of 22 days in Iowa. Note that the chance of 16 or more suitable field days in this period is about 35 percent in each of the three states.
We can now put the four factors together that determine timeliness to project late planting for the 2018 U.S. soybean crop. We know that only about 5 percent of the U.S. soybean crop was planted as of May 1. Since zero late planting is rarely achieved, the chance of more than average late planting as of May 25 is probably a more meaningful computation. As noted above, the average amount of late planting is 39 percent, which implies a target of 61 percent of soybean acreage planted on May 25, or 55 percent planted between May 1 and May 25 (61 – 5 percent). We next need to convert 55 percent planted into suitable field days. Assuming 16 days is the minimum number of suitable field days required to plant the soybean crop, approximately 9 suitable days will be needed to achieve 55 percent planted in the May 1 to May 25 window. Consulting Figures 3-5 as a guide, there is about an 80 to 95 percent chance of achieving 9 or more suitable field days in the heart of the Corn Belt, which is likely a reasonable benchmark for the rest of the U.S. Once again, it is important to emphasize that this should be thought of as the best-case scenario because we are assuming that farmers can plant at peak rates for all 9 suitable field days. It is probably more reasonable to assume that it will actually take 11 to 12 suitable field days to achieve 56 percent of the soybean crop planted between May 1 and May 25. The chance of 12 or more suitable field days occurring in the 25 days is still high, but drops to between about 60 and 70 percent, based on historical distributions for Illinois, Indiana, and Iowa.


Overall, the computations here indicate that there is sufficient time remaining to plant the 2018 U.S. soybean crop in a timely manner. However, the computations are based on the historic distribution of suitable days for field work, which represents a wide range of conditions. The very unusual weather conditions in the to date this spring suggests some caution in projecting historical distributions. Soil temperatures have been unusually low in the northern Corn Belt and conditions are very wet in much of the eastern Corn Belt and the South. These conditions suggest somewhat elevated chances of higher than normal planting delays in planting. Nonetheless, we believe the historical average of 39 percent late planted is a reasonable estimate at this point in the 2018 planting season.
While we are not projecting higher than average late soybean planting for 2018, it could well occur and this would have implications the expected national average soybean yield. Since a number of factors influence the magnitude of the U.S. average soybean yield in any given year, particularly summer weather conditions, it is necessary to estimate the impact of all relevant factors in order to quantify the impact of the timeliness of planting. This is typically done with a crop weather regression model that relates the U.S. average soybean yield to factors such as trend, the percentage of the crop planted late, and an array of weather variables. In brief, based on observations from 1980 through 2017, we specified a crop weather model of the U.S. average soybean yield with a quadratic time trend, late planting as shown in Figure 2, quadratic functions of June, July, and August precipitation, and linear functions of June, July, and August temperatures as explanatory variables. The weather variables are acreage weighted-averages for the Corn Belt and the same as in the crop weather model estimated for corn in the farmdoc daily article of April 25, 2018.
The crop weather model produces an estimate that the U.S. average soybean yield is decreased by 0.05 bushels per acre for each percentage of the crop that is planted after May 25 and this coefficient is statistically significant. Consequently, the estimated yield impact of late planting that exceeds average is not trivial. As indicated in Figure 2, the percent of the U.S. soybean crop planted late averaged 39 percent from 1980 through 2017. The coefficient estimate implies that for each 10 percentage points that late planting exceeds the average level the national average soybean yield is reduced by 0.5 bushels (10 X -0.05). While the coefficient estimate on late planting for soybeans (-0.05) is much smaller than for corn (-0.254) this does not necessarily imply that late planting impacts on soybean yield are much less important. Compared to trend yield projections for 2018, each 10 percentage points that late planting exceeds average the national average soybean yield is reduced 1 percent and the national average corn yield is reduced 1.5 percent. So, late planting impacts are potentially consequential in both corn and soybeans.
In our webinar after the March 30 USDA reports, we presented a quadratic trend yield projection of the 2018 national average soybean yield of 48.5 bushels per acre based on observations from 1960-2017. Since we are not forecasting at the present time late soybean planting to exceed the average level we are not adjusting this trend forecast. However, if planting progress accelerates or decelerates in coming weeks, the trend forecasts can be easily adjusted based on the late planting estimate outlined above.
Implications
Most of the attention at this point in the season is on corn planting, but planting date is also an important consideration for soybeans. Our computations indicate that there is still sufficient time remaining to plant the 2018 U.S. soybean crop in a timely manner before May 25. If we assume that 12 suitable field days are needed between May 1 and May 25 to plant the soybean crop given current conditions, historical distributions for Illinois, Indiana, and Iowa indicate there is about a 60 and 70 percent chance of this occurring. However, the computations are based on the historic distribution of suitable days for field work, which represents a wide range of conditions. The very unusual weather conditions in the to date this spring suggests some caution in projecting historical distributions. Soil temperatures have been unusually low in the northern Corn Belt and conditions are very wet in much of the eastern Corn Belt and the South. These conditions suggest somewhat elevated chances of higher than normal planting delays. Nonetheless, we believe the historical average of 39 percent late planted after May 25 is a reasonable estimate at this point for 2018. We also estimated the impact of above average late planting using a crop weather model for the U.S. The model estimates that for each 10 percentage points that late planting exceeds average the national average soybean yield is reduced by 0.5 bushels. This can be used to adjust soybean trend yield estimates for the U.S. if 2018 planting progress deviates substantially from average.
References
De Bruin, J. L., and P. Pedersen. “Soybean Seed Yield Response to Planting Date and Seeding Rate in the Upper Midwest.” Agronomy Journal 100(2008):696-703.
Irwin, S., D. Good, and M. Tannura, “2009 Final Corn and Soybean Yield Forecasts.” Marketing and Outlook Brief 2009-01, Department of Agricultural and Consumer Economics, University of Illinois at Urbana-Champaign, September 2009.
Irwin, S., and T. Hubbs. "Prospects for Timely Planting of the 2018 Corn Crop." farmdoc daily (8):74, Department of Agricultural and Consumer Economics, University of Illinois at Urbana-Champaign, April 25, 2018.
Irwin, S. an T. Hubbs. "How Many Days Does It Take to Plant the U.S. Corn Crop?" farmdoc daily (8):70, Department of Agricultural and Consumer Economics, University of Illinois at Urbana-Champaign, April 19, 2018.
Irwin, S. an T. Hubbs. "How Many Days Does It Take to Plant the U.S. Corn Crop?" farmdoc daily (8):70, Department of Agricultural and Consumer Economics, University of Illinois at Urbana-Champaign, April 19, 2018.
Irwin, S. an T. Hubbs. “Implications of USDA Grain Stocks and Prospective Plantings Reports for Corn and Soybean Prices." farmdoc Webinar Series, Department of Agricultural and Consumer Economics, University of Illinois at Urbana-Champaign, March 30, 2018.
Nafziger, E. "Planting Date for Corn and Soybeans in Illinois." The Bulletin, Department of Crop Sciences, University of Illinois, March 23, 2017. http://bulletin.ipm.illinois.edu/?p=3848
Nafziger, E. “Personal Communication.” 2018.
Orlowski, J. and T. Irby. “Soybean Planting Dates and Maturity Groups for Mississippi.” Mississippi Crop Situation, March 29, 2017. http://www.mississippi-crops.com/wp-content/uploads/2017/03/Figure-2-Stoneville-with-simulated.jpg
USDA, National Agricultural Statistics Service. Crop Progress (release weekly). http://usda.mannlib.cornell.edu/MannUsda/viewDocumentInfo.do?documentID=1048
Disclaimer: We request all readers, electronic media and others follow our citation guidelines when re-posting articles from farmdoc daily. Guidelines are available here. The farmdoc daily website falls under University of Illinois copyright and intellectual property rights. For a detailed statement, please see the University of Illinois Copyright Information and Policies here.


