


The Farm Bill Stalemate, Part 2: The SNAP Question
The September 30th expiration date for the Agricultural Act of 2014 has passed and conference negotiations appear no closer to completion; a period of uncertainty likely to last through at least a lame-duck session after the November elections. Part 1 of this series on the farm bill stalemate reviewed the economic situation for the major supported commodities, as well as the level of assistance they are likely to receive for the 2018 crop (farmdoc daily, September 27, 2018). In Part 2, we explore the issues concerning the Supplemental Nutrition Assistance Program (SNAP) and how they are contributing to the stalemate. The issues surrounding SNAP offer an important contrast to those discussed in Part 1 for covered commodities.
Background: SNAP Basics
SNAP is considered an automatic stabilizer; a program that is counter-cyclical to the economy at large because it responds to downturns, particularly in the labor market (Edmiston 2018; Ganong and Liebman 2013). SNAP benefits are for the purchase of food. By helping with shortfalls between needs and resources, research finds that SNAP can help alleviate food insecurity for adults and children, improve health outcomes and lift some families out of poverty (Ziliak 2016). Most SNAP households (84%) have monthly incomes below the Federal poverty guidelines and nearly half (43%) have monthly income that is less than or equal to 50% of poverty (Oliveria et al., 2018). In 2014, SNAP benefits have been estimated to have raised 4.7 million people out of poverty, including 2.1 million children (Oliveira et al., 2018). Nearly two-thirds of SNAP participants are children or elderly and non-elderly adults with disabilities; they receive 60% of SNAP benefits. More than 30% of all SNAP households had earned income and are considered “working poor” (Oliveira et al., 2018).
To be eligible for SNAP, participants generally must meet two income-based eligibility requirements and an assets limit: (1) gross monthly income below 130 percent of the Federal poverty standard; and (2) net monthly income, minus certain deductions, below 100 percent of the Federal poverty standard (Oliveira et al., 2018; Ganong and Liebman, 2013; Rutledge and Wu, 2014; Wilde, 2012). Table 1 provides an example of the Federal poverty threshold (national weighted average), along with 130% and 100% of that threshold to represent the gross and net monthly eligibility requirements for SNAP based on data from the Census Bureau (U.S. Bureau, Poverty Thresholds 2017). More information on SNAP eligibility is available from USDA, including a pre-screening tool (USDA-FNS, “Am I eligible for SNAP?”).

The maximum available SNAP benefit is based upon USDA’s estimate of the cost of food that can meet a nutritious diet on limited resources (the Thrifty Food Plan). In general, a household’s SNAP benefit is equal to the maximum available ($649 for a household of four in FY2016) minus 30 percent of net income, meaning that benefits are reduced $0.30 for every $1.00 of net income. In Fiscal Year 2016, monthly benefits averaged $255 per household, or $126 per person (Oliveira et al., 2018; Ganong and Liebman, 2013). SNAP benefits have been found to make up a large percentage of all food-at-home spending for those Americans in poverty (Wilde, 2012).
Overall, SNAP provided $63.6 billion in benefits to more than 42 million people in fiscal year 2017 (farmdoc daily April 12, 2018; USDA-FNS, SNAP Data). As an automatic stabilizer, however, SNAP spending and participation are highly variable in response to changing economic conditions and revisions to policy (Oliveira et al., 2018). Program participation reached its all-time high in fiscal year 2013 when the monthly average participation exceeded 47 million people but has decreased by two percent in fiscal years 2014 and 2015, by almost four percent in fiscal year 2016 and five percent in fiscal year 2017.
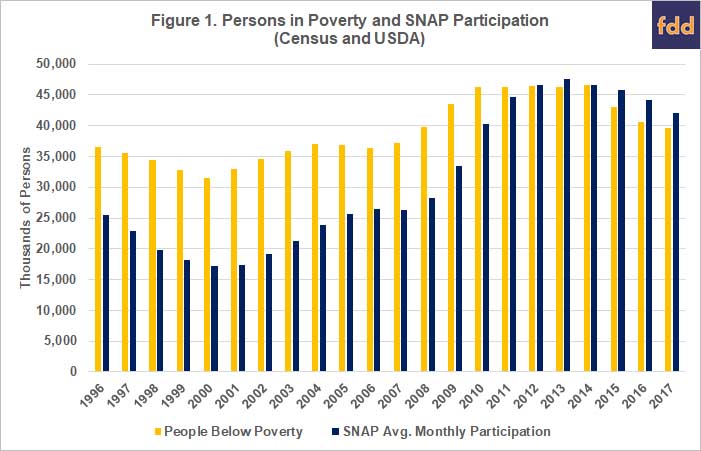
Among the issues for SNAP in the 2018 farm bill debate has been whether SNAP participation has decreased enough given an improving economy and near-historic low unemployment rate. Participation remains above the pre-recession level of 25.9 million (Edmiston, 2018). Research and analysis provides justification. Many people lost their jobs during the Great Recession, causing an increase in the number of Americans who fell into poverty and thus were able to participate in the program. As illustrated in Figure 1 below, 37 million Americans were in poverty in 2007 and poverty peaked in 2014 at 47 million; SNAP participation in 2007 was 26 million but peaked in 2013 at 48 million
Additionally, SNAP participation demonstrates a “lagged relationship” with the unemployment rate that can be potentially as long as two years (Edmiston, 2018; Moffitt, 2015; Ganong and Liebman, 2013). SNAP participation has been found to be more closely linked to long-term unemployment (more than 27 weeks), which typically peaks after short-term unemployment. SNAP participation exhibits much less of a relationship to short-term unemployment. These lags are found going into both economic downturns and recoveries. Researchers speculate that people who lose jobs are likely to exhaust their savings, receive unemployment compensation and other resources, as well as potentially rely on family or friends for an initial period of time. Many families can also be unaware that they are eligible for SNAP benefits, particularly early after becoming unemployed, and this may delay their application for benefits but also contribute to sustaining participation as the economy recovers. Figure 1 compares the number of people in poverty according to the U.S. Census with the monthly average participation in SNAP from USDA.
Poverty is more than unemployment. Low wages, job insecurity, disability and other life events (e.g., children), as well as changes in program operation and population growth, all contribute to poverty and SNAP participation levels. For example, annual growth in SNAP declined from 1974 to 2016 when adjusted for population growth (Edmiston, 2018). More importantly, wages for workers in the middle and bottom of the wage distribution have been relatively flat, as has the poverty threshold (Loprest and Nightingale, 2018). The labor force participation rate continues to decline, according to the Bureau of Labor Statistics (BLS Databases, Tables & Calculators by Subject, Labor Force Participation Rate), which has been a trend that dates to the late 1990s. Many SNAP participants struggle with work situations characterized by high levels of displacement, low wages, stagnant wage growth, variable and uncertain hours from week-to-week and year-to-year (Butcher and Schanzenbach, 2018). This job situation particularly impacts women with a high school degree or less and working mothers.
Moreover, from 2003 to 2007, SNAP caseloads increased during a time of economic recovery and growth, which was the first time in the program’s history and an indicator of more fundamental issues in the economy (Rutledge and Wu, 2014). The poverty rate remained high as unemployment fell during these years, which increased the portion of the population that was eligible for the program and has led some to conclude that SNAP participation may not fall to pre-recession levels (Moffitt, 2015). Researchers have also found that the long-term unemployment rate increased more than the short-term unemployment rate during the Great Recession, leading them to conclude that it has made for a unique situation for SNAP (Edmiston, 2018; Rothstein 2016).
A final and important background note that is especially relevant to a farm bill, SNAP provides larger benefits in society. It has a multiplier effect in the economy by supplementing incomes and helping to boost spending for low-income Americans and households; money freed from food purchases can be used for other needs (Oliveira et al., 2018). USDA research has found that SNAP has a multiplier of 1.73 to 1.79, meaning that “an increase of $1 billion in SNAP benefits increases GDP by $1.73 to $1.79 billion” and “results in an increase of 8,900 to 17,900 full-time equivalent jobs” (Oliveira et al., 2018). SNAP also has indirect benefits for farmers because it results in increased total expenditures on food. USDA research estimates that every $1.00 increase in SNAP benefits increases food spending between a conservatively-low of $0.17 to potentially as much as $0.69 (Oliveira et al., 2018). Every $1.00 increase in food purchases delivers an additional $0.15 back to farmers, known as the “farm share of the food dollar” based on sales of commodities (USDA-ERS, Food Dollar Series). In other words, for every $1.00 increase in SNAP, between $0.03 to $0.10 makes its way to the farmer.
Discussion: Perspectives on the SNAP Disagreement
Much of the disagreement over SNAP in the farm bill conference negotiations is due to the House Ag Committee revisions to the work requirements for SNAP eligibility (farmdoc daily, August 9, 2018; July 3, 2018). This is an issue with a long history and carries significant baggage. Work requirements were first attached to food stamps by former House Agriculture Committee Chairman W.R. Poage (D-TX) in 1971, a strong opponent of the program who lost his chairmanship in 1975 because of that opposition (Rosenfeld, 2010). His views aligned with the strongly-ideological opposition to food stamps from many southern Members of Congress; views connected to opposition to Civil Rights and organized labor (Rosenfeld, 2010; Sherrill, 1970). For example, combining food stamps with farm programs in the 1973 Farm Bill nearly derailed in the House over attempts to prevent striking workers from receiving assistance. Southern views on food assistance and work also trace to a legacy that includes use of New Deal cotton policy to push poor sharecroppers out of cotton farming and into destitution during the Great Depression (Coppess, 2018; Fite, 2015; Conrad, 1965).
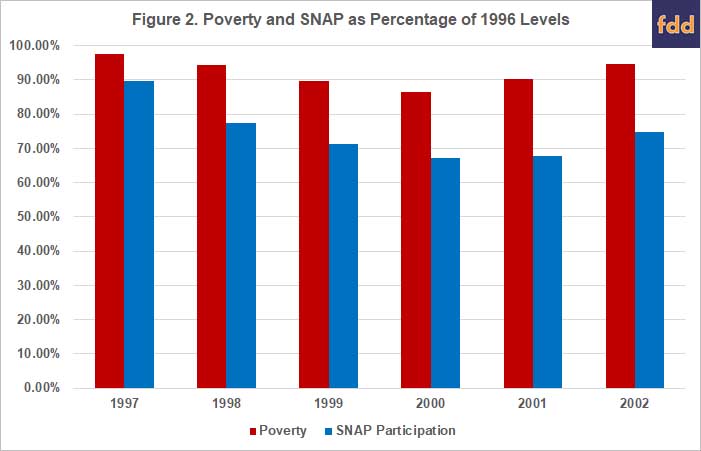
The push for work requirements in 2018 appears to be a recycling of the welfare reform effort between Republicans in Congress and President Clinton (the Personal Responsibility and Work Opportunities Reconciliation Act of 1996, P.L. 104-193). Congress, in that bill, created the first time limits on benefits for able-bodied adults without dependents (ABAWD). That effort placed a three-month time limit on benefits unless the person met specific work (or approved work-related activity) requirements that remains in effect today (Oliveira et al., 2018). It was built on perceptions of who among the needy deserve support and assumed good jobs were available to those who were able to work. By most measures, the economy improved significantly during the 1990s, unemployment fell from its 1992 high of 7.5% to a low of 4.0% in 2000 (Bureau of Labor Statistics). Using 1996 as the benchmark, people below poverty fell from 36.5 million to 31.5 million in 2000 and SNAP participation decreased from 25.5 million to 17.2 million in 2000. As Figure 2 illustrates, SNAP participation fell much further on a percentage basis than did poverty.
That more people stopped participating in SNAP than escaped poverty is telling; so, too, the reactions in Congress and the George W. Bush Administration to partially reverse course in the early 2000s (Oliveira et al., 2018). Concerns at the time were that administrative burdens and program complexity were deterring eligible persons from participating—especially working families—and both worked to ease administration burdens, including nationwide adoption of the Electronic Benefit Transfer (EBT) card system (Oliveira et al., 2018). The 1996 revisions coincide with two difficult trends for reducing SNAP: wages for workers in the middle and bottom of the wage distribution have remained relatively flat since the 1990s; and labor force participation rates have trended down as well (Loprest and Nightingale, 2018).
Tightening work requirements and categorical eligibility provisions are built on long-held beliefs that the program is a disincentive to work and that some people choose the meager benefits over a job and wages. Experience, research and program analysis offer valuable information that appears to stand in stark contrast. Consider, for example, the following from research and analysis:
- Around two-thirds of SNAP participants are children, elderly, or non-elderly adults with disabilities, leaving only a minority of SNAP participants to which work requirements apply (Oliveira et al., 2018);
- At least 25 percent of adults in households without children work while receiving SNAP, and “about 75 percent work in the year before or the year after receiving SNAP” Oliveira et al., 2018);
- In FY 2015, an “estimated 32 percent of all SNAP households had earnings from work,” up from 21% in FY 1995 and an indication that “SNAP has increasingly served the working poor” (Oliveira et al., 2018);
- Among working SNAP recipients, 28.6 percent “remained below the poverty line despite their wages and salaries;”
- In 2017, the unemployment rate for those working in jobs that are common among SNAP participants was 5.3 percent, compared with a national unemployment rate of 3.9 percent and 2.4% for occupations with wages above the median wage (Butcher and Schanzenbach, 2018);
- Jobs common among SNAP participants lack stability; for example, only 40% had five or more years with the same employer compared to 60% for occupations with wages above median wage (Butcher and Schanzenbach, 2018);
- Most research does not find large reductions in work due to SNAP, at most one hour per week, although studies of data from the 1970s did find some reduction for single mothers but was more likely due to the Aid to Families with Dependent Children (Moffitt, 2015);
- Modeling the relationship between unemployment and SNAP enrollment found that “changes in unemployment duration alone can explain about half of the increase in SNAP enrollment from 2007 to 2011” while changes to Broad Based Categorical Eligibility (BBCE) and waivers for Able-Bodied Adults Without Dependents (ABAWD) accounted for 8% and 10% of the increased enrollment during the recession (Ganong and Liebman, 2018).
Concluding Thoughts
Chairman Conaway recently insisted on a farm bill conference report that can receive a majority of Republican votes in the House (McCrimmon, October 2, 2018; Agri-Pulse, September 30, 2018). This may be an even more troubling development for the farm bill—both the current stalemate and possibly for the long run—because it establishes a very partisan threshold for the traditionally bipartisan farm bill, especially a conference report. It is especially concerning given the political reality in the Senate where 68 Senators voted to defeat an amendment that would have added the House’s SNAP provisions (Roll Call Vote 141) and 86 Senators voted to pass a farm bill without them (Roll Call Vote 143).
A better understanding of SNAP may help further explain the current stalemate in conference and the challenges for policies that impact those struggling with poverty and hunger. The information in this article adds to previous analysis regarding the seemingly insurmountable hurdle to a conference agreement presented by the insistence on controversial changes to the Supplemental Nutrition Assistance Program (SNAP). It adds context to the Congressional Budget Office analysis that the SNAP provisions in the House farm bill will spend billions in additional administrative costs, offset by the savings from its reduction in participation.
References
Agri-Pulse.com, Open Mic Interview, September 30, 2018, https://www.agri-pulse.com/media/podcasts/85-agri-pulse-open-mic-interview/play/9436-house-ag-committee-chairman-mike-conaway
Kristin F. Butcher and Diane Whitmore Schanzenbach, “Most Workers in Low-Wage Labor Market Work Substantial Hours, in Volatile Jobs: SNAP or Medicaid Work Requirements Would Be Difficult for Many Low-Wage Workers to Meet,” Center on Budget and Policy Priorities, Policy Futures (July 24, 2018), available online, https://www.cbpp.org/research/poverty-and-inequality/most-workers-in-low-wage-labor-market-work-substantial-hours-in
David Eugene Conrad, The Forgotten Farmers: The Story of Sharecroppers in the New Deal (U. of Illinois Press, Urbana, 1965)
Jonathan Coppess, The Fault Lines of Farm Policy: A Legislative and Political History of the Farm Bill (U. of Neb. Press, Lincoln, forthcoming 2018)
Coppess, J., C. Zulauf, G. Schnitkey and N. Paulson. "The Farm Bill Stalemate, Part 1: Commodity Assistance." farmdoc daily (8):180, Department of Agricultural and Consumer Economics, University of Illinois at Urbana-Champaign, September 27, 2018.
Coppess, J., C. Zulauf, G. Schnitkey, K. Swanson, N. Paulson and B. Gramig. "2018 Farm Bill Updated: Conference Negotiations Begin." farmdoc daily (8):148, Department of Agricultural and Consumer Economics, University of Illinois at Urbana-Champaign, August 9, 2018.
Coppess, J., G. Schnitkey, C. Zulauf and N. Paulson. "2018 Farm Bill: Two Big Steps Forward & the Top Five Issues for Conference." farmdoc daily (8):122, Department of Agricultural and Consumer Economics, University of Illinois at Urbana-Champaign, July 3, 2018.
Coppess, J., G. Schnitkey, N. Paulson and C. Zulauf. "Reviewing the CBO Baseline for 2018 Farm Bill Debate." farmdoc daily (8):65, Department of Agricultural and Consumer Economics, University of Illinois at Urbana-Champaign, April 12, 2018.
Edmiston, K.D., “Structural and Cyclical Trends in the Supplemental Nutrition Assistance Program,” Federal Reserve Bank of Kansas City, kcFED Economic Review (March 29, 2018), at 59, available online, https://www.kansascityfed.org/publications/research/er/articles/2018/1q18edmiston-structural-cyclical-trends
Gilbert Fite, Cotton Fields No More: Southern Agriculture, 1865-1980 (The University Press of Kentucky, Lexington, KY 2015)
Peter Ganong and Jeffrey B. Liebman, “The Decline, Rebound, and Further Rise in SNAP Enrollment: Disentangling Business Cycle Fluctuations and Policy Changes,” Faculty Research Working Paper Series, Harvard University, John F. Kennedy School of Government, RWP13-037 (October 2013), at 5, available online, https://www.hks.harvard.edu/publications/decline-rebound-and-further-rise-snap-enrollment-disentangling-business-cycle
Pamela Loprest and Demetra Nightingale, “The Nature of Work and the Social Safety Net,” The Urban Institute, July 2018, at 2, available online, https://www.urban.org/sites/default/files/publication/98812/the_nature_of_work_adn_the_social_safety_net.pdf
McCrimmon, R., “Ag and Congress mixed on new NAFTA,” Politico.com, Morning Agriculture, October 2, 2018, https://www.politico.com/newsletters/morning-agriculture/2018/10/02/ag-and-congress-mixed-on-new-nafta-359369
Robert Moffitt, “The U.S. Safety Net and Work Incentives: The Great Recession and Beyond,” J. of Policy Analysis and Management, 34(2) (2015), 458-466.
Victor Oliveira, Mark Press, Laura Tiehen, and David Smallwood, “Design Issues in USDA’s Supplemental Nutrition Assistance Program: Looking Ahead by Looking Back,” U.S. Dept. of Agric., Econ. Research Svc., Economic Research Report No. 243 (January 2018), available online, https://www.ers.usda.gov/publications/pub-details/?pubid=86923
Sam Rosenfeld, “Fed by Reform: Congressional Politics, Partisan Change, and the Food Stamp Program, 1961-1981,” The Journal of Policy History, vol. 22, no. 4 (2010), 474-507
Donna S. Rothstein, "An analysis of long-term unemployment," Monthly Labor Review, U.S. Bureau of Labor Statistics, July 2016, https://doi.org/10.21916/mlr.2016.32, available online, https://www.bls.gov/opub/mlr/2016/article/an-analysis-of-long-term-unemployment.htm
Matthew S. Rutledge and April Yanyuan Wu, “Why Do SSI and SNAP Enrollments Rise in Good Economic Times and Bad?”, Center for Retirement and Research at Boston College, 2014, available online, http://crr.bc.edu/wp-content/uploads/2014/06/wp_2014-10.pdf
Sherril, R. “Why Can’t We Just Give Them Food.” The New York Times, Archives, March 22, 1970, https://www.nytimes.com/1970/03/22/archives/why-cant-we-just-give-them-food-why-cant-we-just-give-them-food.html
James P. Ziliak, “Modernizing SNAP Benefits,” Brookings, The Hamilton Project (May 2016), available online, http://www.hamiltonproject.org/assets/files/ziliak_modernizing_snap_benefits.pdf
Disclaimer: We request all readers, electronic media and others follow our citation guidelines when re-posting articles from farmdoc daily. Guidelines are available here. The farmdoc daily website falls under University of Illinois copyright and intellectual property rights. For a detailed statement, please see the University of Illinois Copyright Information and Policies here.