America’s Twin Deficits since 1980
President Trump argues unfair trade imbalances must be corrected, leading his Presidency to impose administratively-determined tariffs at a level and scope unparalleled since before World War II. Concurrently, the Tax Cuts and Jobs Act of 2017, arguably its signature legislative achievement, reduced business and personal taxes with anticipated economic stimulus effects. However, this Act may worsen the trade deficit by stimulating imports, and the Congressional Budget Office forecasts it will increase the Federal fiscal budget deficit. This article reviews what is often called “America’s twin deficits” using data from the US National Income and Product Accounts, (see first Data Note and Source). The review starts with 1980, when President Ronald Reagan’s election launched the US on a fiscal policy path dominated by tax cuts.
Twin Deficits Post 1980
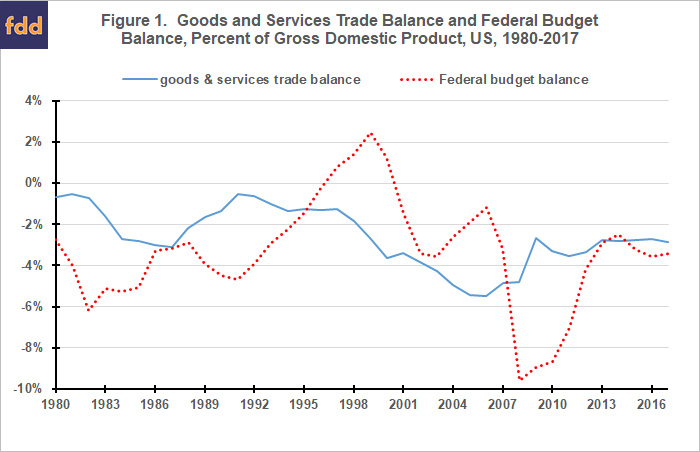
In 1982, the Federal fiscal deficit was -6% of Gross Domestic Product (GDP) (see Figure 1). Contributing factors were (1) a deep recession, largely attributed to the Federal Reserve’s decision to aggressively raise interest rates to bring down high inflation that emerged in the 1970s, and (2) 1981 tax cuts championed by the Reagan administration, particularly for the highest personal income tax brackets. The fiscal deficit fell as the economy grew, however, the decline was reversed by the 1986 tax cuts and then the first Iraq war of 1990-1991.

In 1992 the US fiscal deficit began a steady decline. Credit is usually given to (1) the 1990 tax increase enacted as a bipartisan compromise under President George H. W. Bush and (2) the 1993 tax increase and tight fiscal policies enacted during President William Clinton’s two terms. The only fiscal surpluses since 1980 emerged in 1997-2000. Fiscal deficits returned in the early 2000s as Federal spending across the board began to increase, reinforced by further tax cuts and the costs of the war on terrorism and the second Iraq war under President George W. Bush.
The goods and services trade deficit, which had fluctuated between -0.5% and -3.1% of GDP since 1980, began to increase after 1996. The Asian financial crisis caused foreign investors to use the US as a safe haven, with the lending that ensued contributing to a larger trade deficit. China also began to accumulate official foreign reserve holdings of dollar denominated assets, leading to concerns about US dependence on Chinese financing and an undervalued Yuan. The trade deficit peaked at -5.5% of GDP in 2005 and 2006. With the fiscal and trade deficit both rising, potential danger of the twin deficits heightened. A specific concern was that slowing, let alone cessation, in foreign financial inflows might throw the US economy into a tailspin.
The 10-year run of rising trade deficits relative to GDP ended with the onset of the financial crisis and the great recession that began in 2008. The fiscal deficit tripled, while the trade deficit shrank, opening a large gap between them. Key factors were a collapse in investment and increase in private saving. Net domestic investment declined from 7.0% to 1.4% of GDP between 2007 and 2009, while net private savings increased from 4.7% to 8.5% of GDP. As a slow economic recovery gained strength, the fiscal deficit declined, with the twin deficits settling at similar, more moderate levels in 2013 through 2017.
Relationship
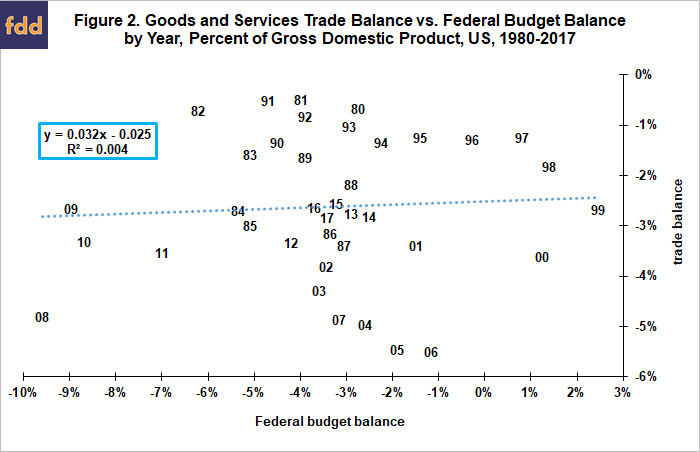
This discussion of the twin deficits points to an obvious question, “What is the statistical relationship between them?” Since 1980, no statistically significant relationship exists on an annual basis (see Figure 2). Figure 1 foreshadows this finding by revealing that the multiple-year trends characteristic of both deficits can be in the same or opposite direction.

Summary Observations
- The Trump Presidency has made trade imbalances it considers unfair a policy focus.
- At the same time, recovery from the great recession has strengthened, stimulated in part by the Tax Cuts and Jobs Act of 2017. Income growth has picked up and the dollar has appreciated, both outcomes that historically have drawn in more imports.
- The linking together of US trade and fiscal deficits is a reoccurring storyline since 1980.
- However, a review of the often-called twin deficits reveals that, while they can move together, the cumulative evidence is of no year-by-year statistical relationship.
- The trade and fiscal deficits are characterized by trends that extend over multiple years, with trends in both deficits determined by market events and changes in government policy.
- A key economic question is whether the combination of President Trump’s tariff policy together with the 2017 tax cuts will undo or extend the recent five-year period of relative stability and similarity in the US trade deficit and Federal budget deficit measured as a percent of GDP.
- The honest response is, “we do not know,” in part because this policy combination has no recent historical antecedent that can provide guidance. Whatever your view of US trade and fiscal policies of the last two years, we all should hope the President and, now a divided Congress, can figure out and adopt a policy path that works moving forward. The alternative could have unpleasant consequences.
Data Notes and Sources:
- National Income and Product Account data used are the trade balance on goods and services (line 31, Table 1.1, U.S. International Transactions) and net private saving, net government saving – Federal, and net domestic investment (lines 3, 11, and 49, respectively; Table 5.1, Savings and Investment by Sector). December 2018.
- For additional discussion of Federal deficits and budget legislation, see Coppess, J. “Federal Budget Discipline and Reform: A Review and Discussion, Part 1.” farmdoc daily (8):218, Department of Agricultural and Consumer Economics, University of Illinois at Urbana-Champaign, November 29, 2018.
Disclaimer: We request all readers, electronic media and others follow our citation guidelines when re-posting articles from farmdoc daily. Guidelines are available here. The farmdoc daily website falls under University of Illinois copyright and intellectual property rights. For a detailed statement, please see the University of Illinois Copyright Information and Policies here.


