


2018 Year End RIN Update
Today’s article provides the annual summary update on Renewable Identification Number (RIN) generation in 2018 based on available data from EPA’s EMTS. Previous quarterly updates covered RIN generation through the first three quarters of 2018 (October 31, 2018; July 26, 2018; May 23, 2018).
The RIN data from EMTS are combined with ethanol export data from the US Department of Commerce (DOC) via the USITC DataWeb and biodiesel export data from the Energy Information Administration (EIA) to compare estimated net RIN generation to targeted RFS mandate needs based on EPA’s final rulemaking for 2018.
Advanced RIN Generation
Table 1 reports gross RIN generation and then makes adjustments for non-compliance and export retirements to arrive at an estimate of net generation across the D-code categories for 2018. Net generation figures are then compared with the 2018 volumetric mandate levels outlined in EPA’s final rulemaking to estimate a surplus (deficit) for 2018. Generation activity within each D-code category is discussed individually below.

Total generation of cellulosic (D3 and D7) RINs reached 285 million in 2018. For the D3 category, this includes 274.4 million RIN gallons of renewable compressed and liquefied natural gas, and 8.1 million gallons of cellulosic ethanol. Also includes are 2.44 million RINs from cellulosic heating oil and 11 thousand RINs from cellulosic diesel, both in the D7 category. Non-compliance retirements of cellulosic RINs currently reported total 0.9 million. This puts net generation at 284 million for 2018, just 4 million short of the 288 million RIN mandate for cellulosic.
Figure 1 plots monthly D4 RIN generation relative to implied biomass-based diesel monthly mandate needs (annual mandate divided by 12) using data from the EMTS through December 2018. Gross generation of D4 RINs averaged 262 million per month during the first quarter, increased to 327.5 million per month in the second and third quarters, and increased further to 365.8 million per month in the fourth quarter. Total generation of D4 RINs is reported at 3.85 billion RIN gallons, up slightly from the amount generated in 2017.

Non-compliance retirements of 2018 D4 RINs are currently at 38.9 million. Data from EIA suggest a total of 111 million gallons of biodiesel exports, which translates to 166 million RINs. This results in net generation of 3.645 billion RINs or 495 million more than the 3.15 billion RIN (2 billion volumetric) mandate for 2018.
Gross generation of D5 RINs averaged 6.8 million per month over the first and second quarters, strengthened to 17.3 million per month in the third quarter, and increased again to 15.1 million per month in the fourth quarter. More than 168 million D5 RINs were generated in 2018, and after accounting for approximately 600,000 non-compliance retirements, net generation of D5 RINs stands at 167.5 million for 2018. Net generation of D5 RINs falls well short of the undifferentiated advanced mandate gap of 852 million gallons. The undifferentiated advanced gap represents the difference between the total advanced mandate (4.29 billion RINs), and the biodiesel and cellulosic mandate levels (3.15 billion and 288 million RINs, respectively). Note that this advanced gap can be filled with any advanced RIN category (D3, D4, D5, or D7).
Combining RIN generation and non-compliance retirement data across all advanced categories (D3, D4, D5, and D7), and accounting for biodiesel exports results in net generation of 4.097 billion advanced RINs in 2018. This falls 193 million RINs short of the 2018 total advanced mandate of 4.29 billion RINs.
D6 RIN Generation
Figure 2 plots D6 RIN generation relative to implied mandate needs through December 2018. Monthly gross generation was relatively stable through the year, averaging 1.26 billion, resulting in total generation of just over 15.1 billion D6 RINs in 2018.
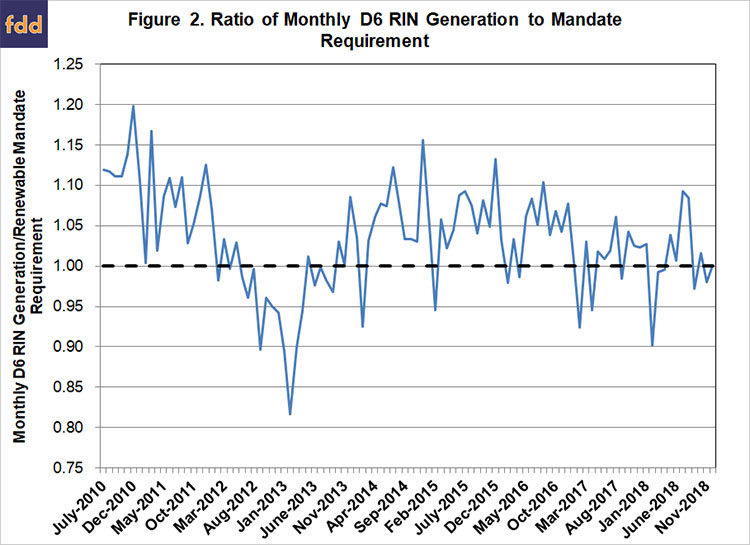
To account for D6 RINs which are retired and unavailable due to export of the biofuel, data from USITC’s DataWeb for denatured exports for fuel use are subtracted from gross D6 generation. Ethanol exports for both undenatured and denatured ethanol for fuel use are reported. Undenatured ethanol exports are assumed to be produced specifically for export and thus never generate a RIN.
Denatured ethanol exports have averaged over 77 million gallons per month through November. This suggests total denatured ethanol exports will reach 930 million gallons in 2018. Non-compliance retirements of D6 RINs are currently reported at 40.5 million. Thus, net generation of D6 RINs is estimated at 14.07 billion, more than 900 million short of the 15 billion gallon conventional portion of the total mandate for 2018 towards which D6 RINs can be applied for compliance.
Summary
Similar to last year, RIN generation data included in the previous quarterly updates during 2018 suggested a deficit relative to RFS mandate levels. Based on all RIN generation, non-compliance retirement, and export data available at this time, net generation did fall more than 1 billion RINs short of the 19.29 billion mandate level for 2018. This includes a net deficit of 288 million in the advanced categories, and a more than 900 million RIN deficit for the renewable gap towards which D6 RINs can be applied.
Reviewing current, updated RIN data for 2017 suggest a larger deficit than was previously reported (see post from February 8, 2018), also exceeding 1 billion RIN gallons. Thus, estimated net generation has fallen around 1 billion RINs short of volumetric mandate targets for 2 consecutive years.
Previous RIN stock estimates indicated the potential for more than 1.8 billion in available carryover coming into the 2017 compliance year (see the daily post from November 8, 2017). The estimated deficits for 2017 and 2018 would fully exhaust that level of RIN stocks. However, smaller refiner exemptions (SMEs) for the 2016 and 2017 compliance periods announced by EPA in September 2018 totaled more than 2.2 billion RINs. Thus, RIN stocks have likely not been significantly reduced from the estimates leading into 2017. Generation activity in 2018 suggests that the market may expect at least some level of SME request approvals for 2018 as well.
References
Environmental Protection Agency. "Renewable Fuel Standard Program: Standards for 2018 and Biomass Based Diesel Volume for 2019; Final Rule." Federal Register 82(237), December 12, 2017. https://www.govinfo.gov/content/pkg/FR-2017-12-12/pdf/2017-26426.pdf
Paulson, N. "2018 Third Quarter RIN Update." farmdoc daily (8):201, Department of Agricultural and Consumer Economics, University of Illinois at Urbana-Champaign, October 31, 2018.
Paulson, N. "2018 Mid-Year RIN Update." farmdoc daily (8):138, Department of Agricultural and Consumer Economics, University of Illinois at Urbana-Champaign, July 26, 2018.
Paulson, N. "2018 First Quarter RIN Update." farmdoc daily (8):94, Department of Agricultural and Consumer Economics, University of Illinois at Urbana-Champaign, May 23, 2018.
Paulson, N. "2017 Year End RIN Update." farmdoc daily (8):21, Department of Agricultural and Consumer Economics, University of Illinois at Urbana-Champaign, February 8, 2018.
Paulson, N. "RIN Stock Update Under Alternative RFS Implementation Scenarios." farmdoc daily (7):206, Department of Agricultural and Consumer Economics, University of Illinois at Urbana-Champaign, November 8, 2017.
USITC Interactive Tariff and Trade DataWeb. https://dataweb.usitc.gov/
U. S. Energy Information Administration. "Petroleum & Other Liquids: Exports." Released January 31, 2018, last accessed February 24, 2019.http://www.eia.gov/dnav/pet/pet_move_exp_dc_NUS-Z00_mbbl_m.htm
Disclaimer: We request all readers, electronic media and others follow our citation guidelines when re-posting articles from farmdoc daily. Guidelines are available here. The farmdoc daily website falls under University of Illinois copyright and intellectual property rights. For a detailed statement, please see the University of Illinois Copyright Information and Policies here.