


Does Family Living Costs for Farms Differ by Region in Illinois?
We know that the cost of living differs among cities throughout Illinois. Do farm families also have different costs of living based on what part of Illinois they live in? Using farms enrolled in Illinois Farm Business Farm Management (FBFM) Association, we divided the farms into three regions, North, Central, and South. Farms located in the 22 counties north and northwest of the Illinois River are included in the sample for northern Illinois. Farms from 36 counties below a line from about Mattoon to Alton are in the sample for southern Illinois. The remaining 44 counties make up the sample for central Illinois.
Farms in this sample kept track of every dollar in and out of the operation as well as for off-farm income and family living expenses. Table 1 shows some of the selected items of family living by region for 2017.
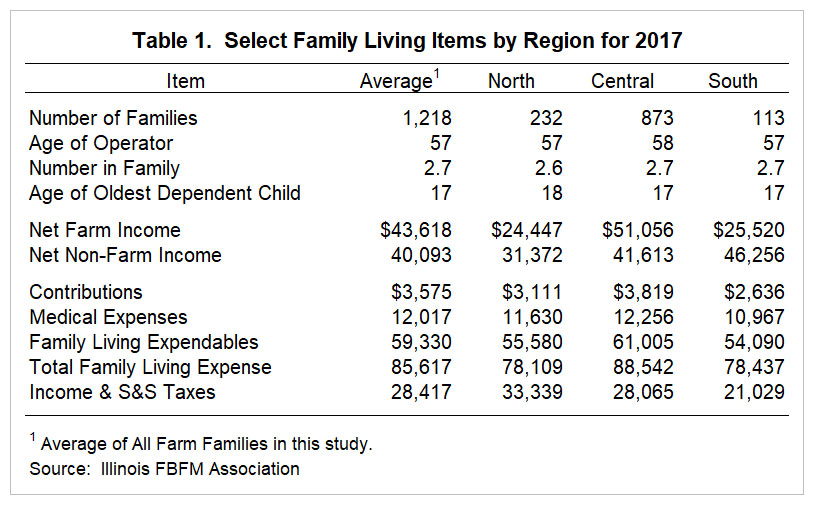
Of the farm families in this study shown in Table 1, the central region had the largest portion at 72 percent of the farms. The northern region at 19 percent and the southern region at 9 percent made up the rest of the data. Net farm income is the accrual value for 2017. Table 1 shows that the northern and southern regions had similar incomes, but were almost half of the net farm income that the central part of the state experienced. Net non-farm income is all other income in the farm family minus expenses. Examples of this are wages, interest income, off-farm business, etc. For 2017, the net non-farm income increased as you moved south through Illinois with the southern region having the highest amount at $46,256. When you combine both types of income in these farm families in 2017, the central region was the highest at $71,776 while the southern region was at $71,776 and the northern region was at $55,819.
When looking at selected expense items for 2017 in Table 1, all of the items were the greatest for the central region besides income and social security taxes. Income and social security taxes is the amount of cash paid in the current year that is most likely for the remaining tax from the prior year. There are various reasons why the region with the highest amount of tax paid is not the same as the region with the highest income. Examples of these reasons are higher incomes the year before; the amount of tax paid is based on cash net farm income and we report accrual net farm income; differences in types of income; and how they are taxed as well as many other factors.
When looking at total family living expenses by region for 2017, the northern and southern regions are almost the same even though total income was about $20,000 different. Total family living expenses include contributions, medical expenses, life and disability insurance, family living expendables (food, utilities, household supplies, etc.) and family living capital (personal purchases above $250 for capital items). Even though the northern and southern regions were almost the same for total family living expenses in 2017, the central region was almost $10,000 greater with the majority of this difference in family living expendables.
Figure 1 shows total family living expenses by region for a ten-year period from 2008 to 2017 for Illinois FBFM farm families. During that ten-year period, the central region had the highest total family living cost, except for in 2011 when the southern region was slightly higher. The central and northern regions seem to follow each other closely from year to year. However, the southern region does not follow this trend over the entire ten-year period. The decrease from 2011 to 2012 in the southern region was primarily due to the drought causing many fields to be destroyed by the middle of the summer in that region. Seeing the loss of entire fields had an impact on farm families, which lead to a decrease in family living spending in the south. The highest family living expense by region was in 2013 for the northern and central regions while was the highest for the southern region in 2014. For all regions, total family living expenses have been primarily on a downward trend since their highs.
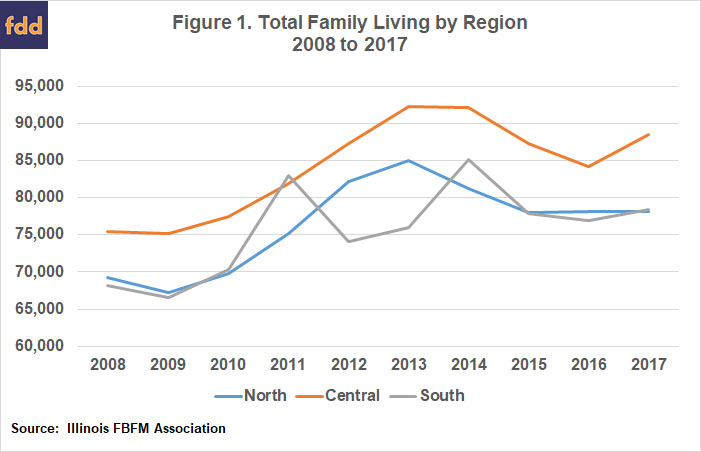
Family living costs for farms do differ by region when looking at a sample of farms enrolled in Illinois FBFM Association. The central region of the state has shown the highest total family living cost over the last ten years, except for 2011, when the southern region was slightly higher. Over the ten-year period, the central region on average was more than $7,000 higher than the northern region and $8,000 higher than the southern region. When reviewing the family living costs in more detail in 2017, the central region was higher in all categories with the majority being in family living expendables. For all regions, total family living costs have been trending down the last three to four years. This is primarily due to lower margins and tighter cash flows on the farm. By having a handle on every dollar of their operation and family living, these families have seen that not only do they need to monitor farm expenses but family living expenses as well.
Disclaimer: We request all readers, electronic media and others follow our citation guidelines when re-posting articles from farmdoc daily. Guidelines are available here. The farmdoc daily website falls under University of Illinois copyright and intellectual property rights. For a detailed statement, please see the University of Illinois Copyright Information and Policies here.