


Federal Budget Discussion, Part 2: Revenues and Spending
Part 1 opened this series by providing some initial background information and a quick overview of federal budget basics (farmdoc daily, November 29, 2018). This article continues the budget discussion with a review of revenue and spending data as reported by the Congressional Budget Office. Where spending exceeds revenue in any year, the federal government runs a deficit; each year of deficit adds to the federal debt. This article reviews specific categories of both revenues and spending.
Background
Beginning with the big picture from the Congressional Budget Office (CBO), which reports regularly on the budget outlook. On March 6, 2019, CBO provided an updated outlook for the budget through 2029; the graphic below is from that presentation (CBO Budget Outlook, March 6, 2019). CBO’s illustration is a historical perspective of the federal debt held by the public as a percentage of Gross Domestic Product (GDP), including projections well into the future.
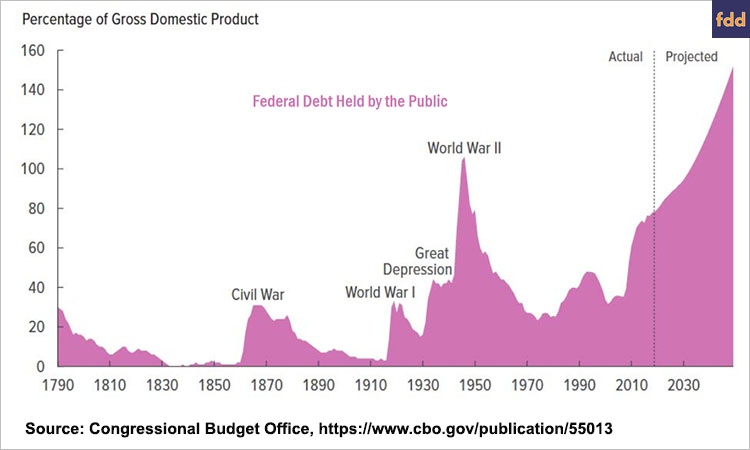
CBO’s historical perspective on the federal debt provides clear illustration for the political fixation on this topic. According to CBO projections, the federal debt will reach levels that are unprecedented, exceeding debt levels experienced during World War II. Taking CBO’s federal debt chart as the starting point, the following discussion provides a breakdown of the building blocks of the debt.
Discussion
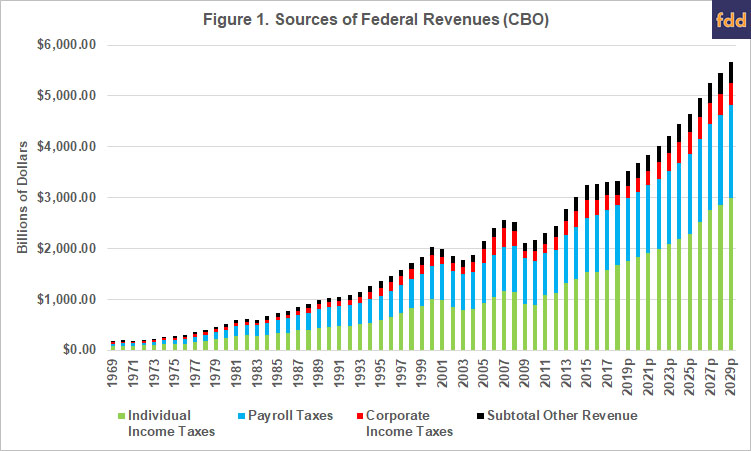
As discussed in Part 1 of this series, the federal debt is the product of yearly deficits that are the result of federal expenditures exceeding federal revenues (farmdoc daily, November 29, 2018). Figure 1 illustrates the major sources of federal revenues as reported by CBO, covering historic revenues from 1969 and the projections through 2029 (CBO, Historical Budget Data, January 2019; CBO, 10-Year Projections, January 2019). According to CBO data, the largest sources of federal revenues are from individual income taxes (green), which have grown from $87 billion in 1969 to $1.7 trillion by 2018. CBO’s projections are for income taxes to average $2.3 trillion from 2019 to 2029. The next highest source of revenue is from payroll taxes (blue), which have grown from $39 billion in 1969 to $1.2 trillion in 2018; CBO projects average payroll taxes of $1.5 trillion in the next ten years. The other sources of revenue (black) consist of excise taxes, estate and gift taxes, customs duties and miscellaneous receipts. Corporate income taxes (red) constitute a smaller share of revenue, growing from $36.7 billion in 1969 to $205 billion in 2018; CBO projects an average of $364 billion from 2019 to 2029.
To add context to CBO’s reported and projected data, Figure 2 illustrates each category of revenues as a percentage of the total revenues taken in by the federal government. Again, it is clear in Figure 2 that individual income taxes (green) have consistently made up the largest portion of federal revenues, followed by payroll taxes (blue). From 1969 to 2018, individual income taxes averaged 45.8% of total revenues and payroll taxes averaged 33.75%; roughly 80% of federal revenues come from these two sources. By comparison, corporate income taxes averaged 11% over that time frame. Additionally, CBO projects that the individual income share of revenues will average 50.5% from 2019 to 2029, while payroll taxes will stay relatively at the same level averaging 33.7%. Corporate income taxes are projected to fall to just over 8% for the 2019 to 2029 years in CBO’s projections.
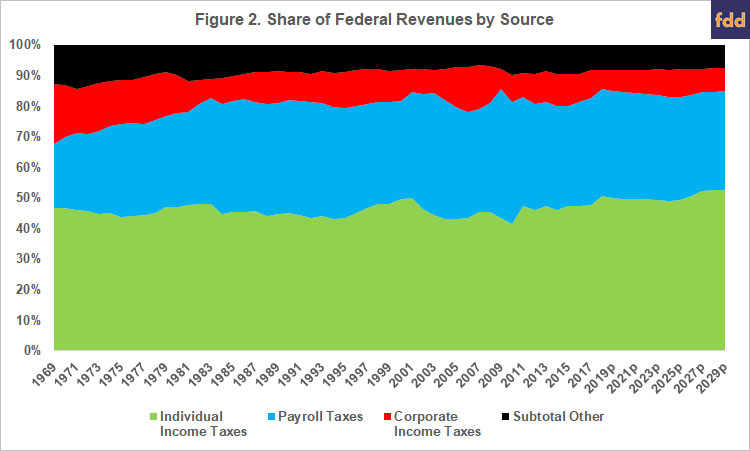
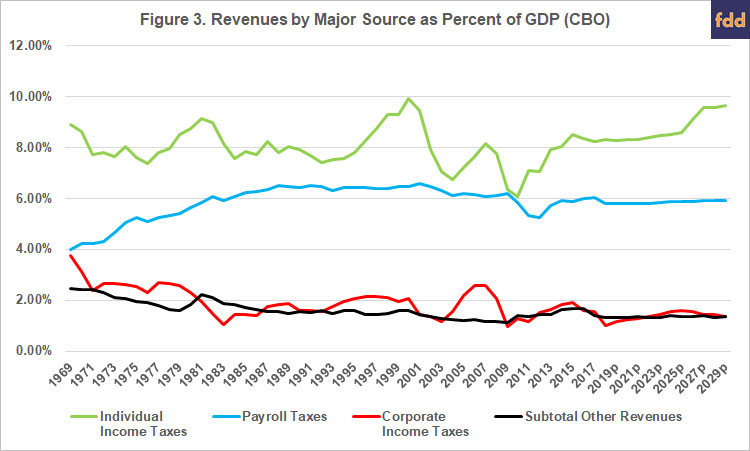
Figure 3 provides an additional measure of revenues as reported by CBO, the percentage of Gross Domestic Product (GDP) for each category of revenues. Most notable is the divergent path of payroll taxes and corporate income taxes, both start off around 4% of GDP in 1969 but payroll taxes grow to around 6% of GDP while corporate income taxes fall to 2% or less. In fact, CBO reported that corporate income taxes fell to 1.01% in 2018 but are expected to rise to 1.6% in 2025 before falling again. Payroll taxes are projected to remain steady at around 5.8% of GDP but individual income taxes are projected to increase from 8.3% in 2018 to 9.6% in 2029.
The other part of the deficit is federal spending. Figure 4 illustrates CBO’s reported historic data by major category of spending and CBO’s projections for 2019 through 2029. The category “Other Mandatory Programs (less offsetting receipts)” in Figure 4 (blue bars) consists of income security programs, federal civilian and military retirement, veteran’s programs and all other mandatory programs, minus the offsetting receipts for some of these mandatory programs. This is the category that would include entitlement spending for farm programs, crop insurance, conservation and the Supplemental Nutrition Assistance Program (SNAP) in the farm bill. The discretionary spending accounts are appropriated each year (as compared to mandatory spending in entitlement programs) and are split between defense and nondefense programs. The third subset is the net interest on the federal debt (black).
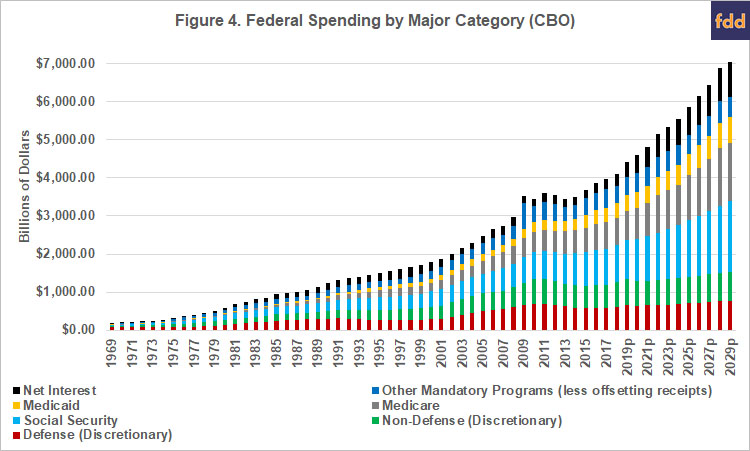
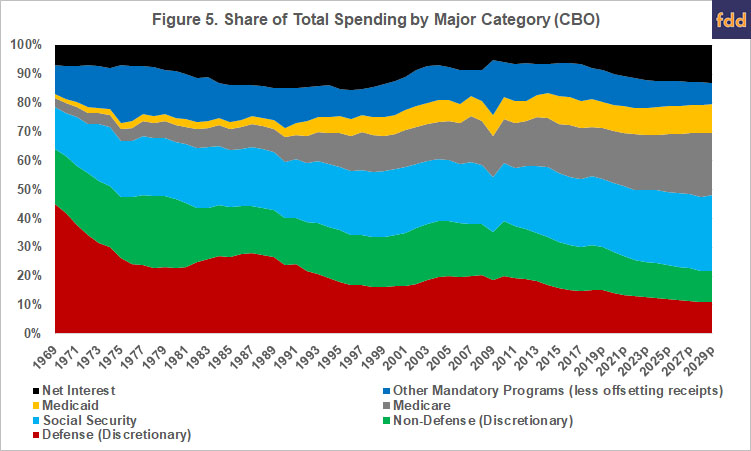
Figure 5 adds further perspective by illustrating each of the major categories of spending as a percentage of total spending (both mandatory and discretionary), using the same categories. In terms of general trends, defense spending has fallen consistently as a percentage of total spending from 45% in 1969 to around 11% in 2018; it has grown in terms of total dollars spent, however, from just under $83 billion in 1969 to more than $620 billion in 2018. By comparison, Social Security spending has grown from just under $27 billion in 1969 to over $980 billion in 2018. Combined, Medicaid and Medicare have gone from roughly $8.5 billion in 1969 to almost $1.1 trillion in 2018.
Finally, Figure 6 illustrates CBO’s reporting of the major categories of spending as a percentage of Gross Domestic Product (GDP). This further demonstrates the decrease in spending for defense and the growth for Social Security, Medicaid and Medicare. In 1969, Social Security spending was 2.7% of GDP while defense spending was 8.44% and other mandatory spending was just under 3% of GDP. By 2018, Social Security was 4.85% of GDP and defense was just over 3%; other mandatory spending was almost 3.5%. By comparison, Medicare spending has gone from 0.6% in 1969 to nearly 3.5% in 2018, while Medicaid has gone from 0.23% in 1969 to just below 2% in 2018.
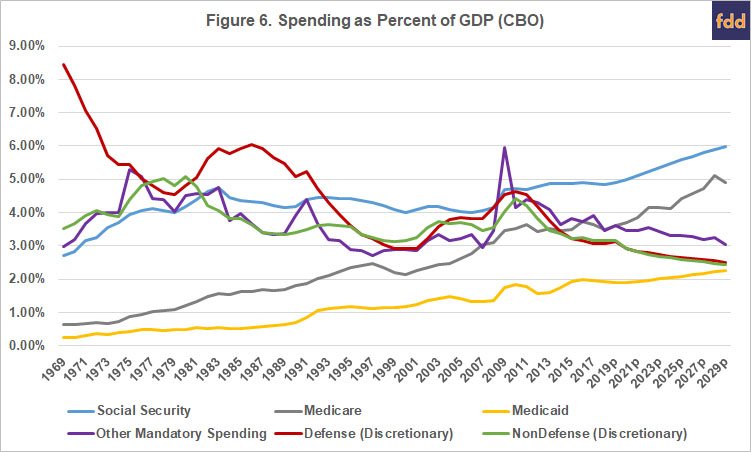
The impacts of the Great Recession on spending are another notable data point in Figure 6; spiking to nearly 6% of GDP in 2009 from 2.9% in 2007. That corresponds to an increase in outlays that went from $242 billion in 2007 to more than $660 billion in 2009. Spending on these mandatory programs has decreased steadily since 2009, falling to over $440 billion in 2018 or 3.47% of GDP. In general, these numbers demonstrate the counter-cyclical nature of the mandatory entitlement programs such as SNAP.
Concluding Thoughts
To conclude part 2 of this series, Figure 7 updates the CBO graphic in the background section. Figure 7 illustrates federal debt held by the public (red), federal outlays (navy line) revenues (green line) all as a percentage of GDP from 1969 to projections for 2029. To better illustrate the degree of changes over time, federal debt is shown on a separate axis (right-hand) from 0% to 100% while revenues and outlays using the left-hand axis from 10% to 25%.
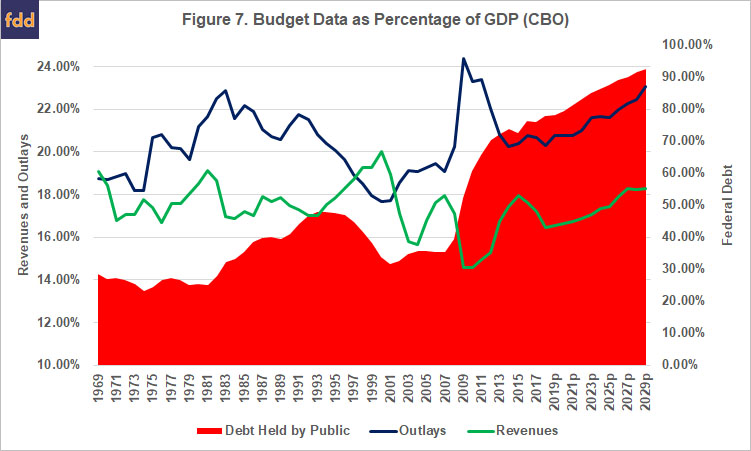
According to CBO, the nation ran a $3 billion surplus in 1969 and the federal debt was nearly $280 billion. At that time, the debt was 28% of GDP on revenues that were 19% of GDP and spending that was 18.7% of GDP. In 2018, CBO reported that the federal debt was 77.8% of GDP; spending was 20% of GDP but revenues were only 16.5% producing a deficit of 3.85% of GDP. As noted earlier, Congress initiated efforts at comprehensive budget discipline in 1974 when revenues were 17.75% of GDP, outlays were 18% and the deficit was -0.4% of GDP. In 1974, the federal debt was down to 23% of GDP. These numbers add further to the federal budget picture but also raise additional questions. Along the revenue and outlay lines are the policy decisions in Congress with respect to tax and spending policies; the extent there are answers to the questions raised they will be found there. Future articles in this series will seek to explore these issues further.
References
Congressional Budget Office, “The Budget Outlook for 2019 to 2029 in 16 Slides,” March 6, 2019, https://www.cbo.gov/publication/55013
Coppess, J. "Federal Budget Discipline and Reform: A Review and Discussion, Part 1." farmdoc daily (8):218, Department of Agricultural and Consumer Economics, University of Illinois at Urbana-Champaign, November 29, 2018.
Disclaimer: We request all readers, electronic media and others follow our citation guidelines when re-posting articles from farmdoc daily. Guidelines are available here. The farmdoc daily website falls under University of Illinois copyright and intellectual property rights. For a detailed statement, please see the University of Illinois Copyright Information and Policies here.