


Cover Crops, 2017 US Census of Agriculture
This is the first of 3 articles that discuss land use practices as reported in the 2017 US Census of Agriculture (see farmdoc daily, July 25 and August 1). Cover crops is examined in this article. Cover crops have attracted intense interest as a practice that may reduce negative impacts of farming on the environment. Potential benefits noted by proponents include less soil erosion and reduced loss of nitrogen and other nutrients from the soil (Myers, Weber, and Tellatin, 2019). Despite the attention paid to cover crops over the last few years, acres planted to cover crops equaled only 3.9% of all US cropland in 2017. Only 2 states (Maine and Maryland) averaged a 1 percentage point per year increase in cover crops as a share of cropland between 2012 and 2017.
Census Question
Section 4 of the 2017 Census of Agriculture questionnaire addressed “Land Use Practices.” One practices was the use of cover crops. Respondents were specifically asked, “During 2017, considering the cropland acres on this operation, how many acres were planted to a cover crop? (Cover crops are planted primarily for managing soil fertility, soil quality, and controlling weeds, pests, and diseases.) Exclude CRP.” (Appendix B, page B-30). The wording of this question means a cover crop could be the only use of land during 2017 or it could have been planted after a harvested crop.
Cover Crops in 2017
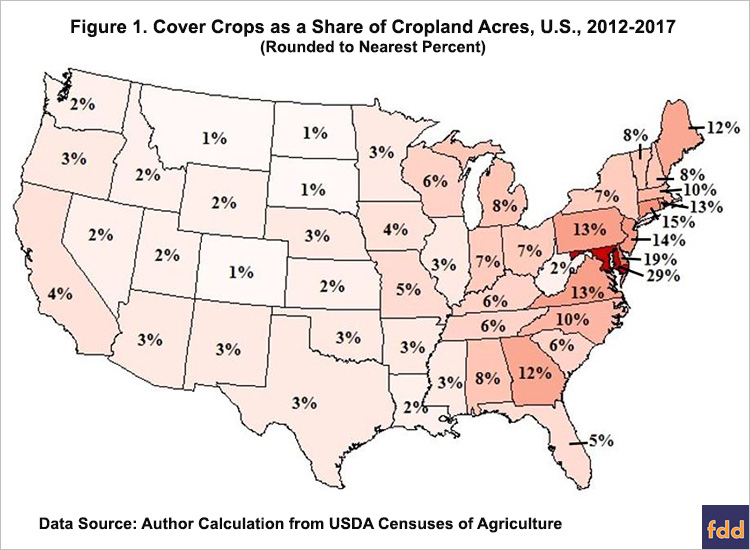
Cover crops in the US totaled 15.4 million acres in 2017, up 50% from the 10.3 million acres in the 2012 Census. Cover crop acres equaled 3.9% of all US cropland in 2017 vs. 2.6% in 2012. The 11 states with cover crops as the highest share of cropland all border the Atlantic Ocean: Maryland (29%), Delaware (20%), Connecticut (15%), New Jersey (14%), Virginia (13%), Rhode Island (13%); Pennsylvania (13%), Georgia (12%), Maine (12%), Massachusetts (10%), and North Carolina (10%) (see Figure 1). The 6 states with the smallest share are in the northern US and, with the exception of Alaska, are associated with drier climates during the growing season: Montana (1%); Alaska (1%), Colorado (1%), South Dakota (1%), North Dakota (1%), and Wyoming (2%). A significant correlation of -0.40 exists between cropland acres and share in cover crops. It differs from zero with 99% statistical confidence. While number of cropland acres explains only 16% (16% = -0.40 squared) of the variation in cover crop share across states; states with more cropland acres tend to have a smaller share in cover crops. A possible explanation is that, assuming all other factors are the same, states with higher urban density tend to have fewer acres of cropland and be more supportive of planting cover crops.
Change from 2012
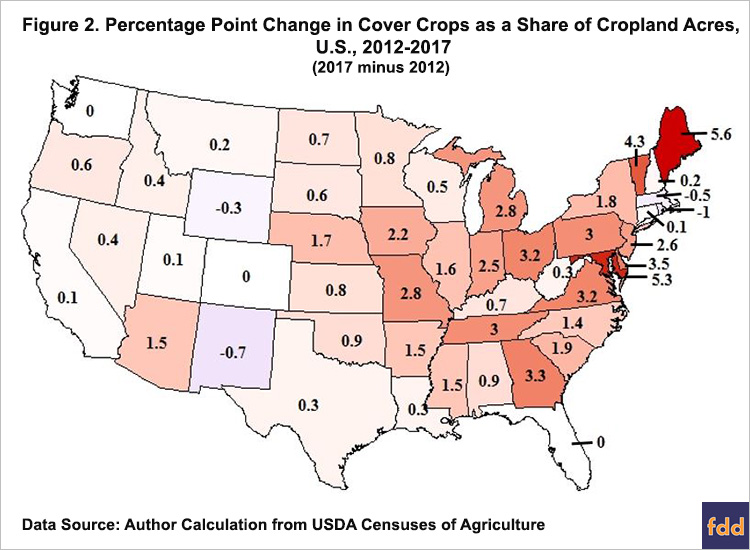
Despite the attention paid to cover crops in recent years, only 2 states averaged a 1 percentage point (pp) per year increase in share of cropland planted to cover crops between the 2012 and 2017 Censuses of Agriculture: Maine (+5.6 pp over 5 years) and Maryland (+5.3 pp over 5 years). Share of cropland acres in cover crops in 2012 has a correlation of +0.34 with the change in cover crop share between 2012 and 2017. The correlation differs from zero with 98% statistical confidence. A higher share in 2012 is thus associated with a higher increase in cover crop share between 2012 and 2017. This finding suggests shifts to cover crops likely has momentum over time.
Summary Observations
- Use of cover crops increased between the 2012 and 2017 Censuses of Agriculture, but cover crops remain a minority land use practice in all US states.
- As of 2017, cover crops are most prevalent in states that border the Atlantic Ocean.
- It is important to gain a better understanding of the wide variation in use of cover crops across states, in particular the relative roles of climate, soil type, production practices, and policy in adoption of cover crops. For example, cover crops are unlikely to be widely used on planted cropland in drier climates where conservation of moisture for the cash crop is a key management concern. Northern climates may also shy away from cover crops due to a shorter growing season.
References
US Department of Agriculture, National Agricultural Statistics Service. (April 2019). 2017 Census of Agriculture: United States Summary and State Data. Volume 1, Geographic Area Series, Part 51. AC-17-A-51 www.agcensus.usda.gov
Myers, R, Weber, A. and Tellatin, S. Cover Crop Economics:Opportunities to Improve Your Bottom Line in Row Crops. SARE Technical Bulletin, US Dartment of Agriculture, National Institute of Food and Agriculture. (June 2019). https://www.sare.org/Learning-Center/Bulletins/Cover-Crop-Economics
Zulauf, C. and B. Brown. “Tillage Practices, 2017 US Census of Agriculture.” farmdoc daily (9): 136. Department of Agricultural and Consumer Economics, University of Illinois at Urbana-Champaign. July 25, 2019.
Zulauf, C. and B. Brown. “Use of Tile, 2017 US Census of Agriculture.” farmdoc daily (9): 141. Department of Agricultural and Consumer Economics, University of Illinois at Urbana-Champaign. August 1, 2019.
Disclaimer: We request all readers, electronic media and others follow our citation guidelines when re-posting articles from farmdoc daily. Guidelines are available here. The farmdoc daily website falls under University of Illinois copyright and intellectual property rights. For a detailed statement, please see the University of Illinois Copyright Information and Policies here.