Tillage Practices, 2017 US Census of Agriculture
This is the second article discussing land use practices as reported in the 2017 US Census of Agriculture (see farmdoc daily, July 24 and August 1). Tillage is examined in this article. Tillage is of interest for several reasons, including its relationship to cost of production, yield, soil compaction, soil erosion, and water quality. Tillage system used in 2017 varies substantially by state. Main change from the 2012 Census was a shift from intensive to reduced tillage. Use of no-till increased marginally.
Census Question
The tillage practice question was asked in the context of cropland acres on the farm. The following identifying phrases were used: “no-till practices,” “reduced (conservation) tillage, excluding no till practices,” and “intensive (conventional) tillage practices” (bolding as in question) (Appendix B, page B-30). Instructions for the questionnaire noted, “Conservation tillage leaves 30 percent or more of the soil surface covered by crop residue after planting. Conventional tillage has 100 percent of the soil surface mixed or inverted” (Appendix B, page B-51).
Analysis
Share of acres in each tillage system is computed using the sum of acres reported in the 3 systems. The share is not computed using cropland or harvested cropland acres because the sum is smaller. The 2017 Census of Agriculture reported total US cropland and harvested cropland at 396 and 320 million acres, respectively. Acres in the 3 tillage systems summed to 282 million.
No-Till
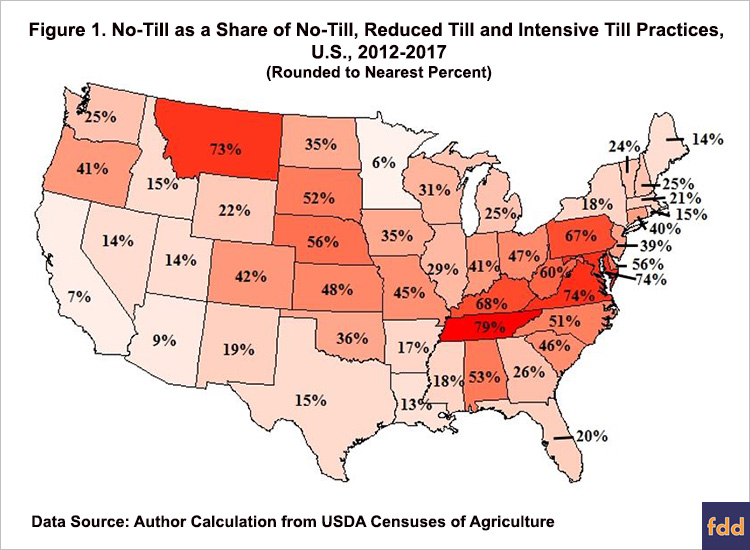
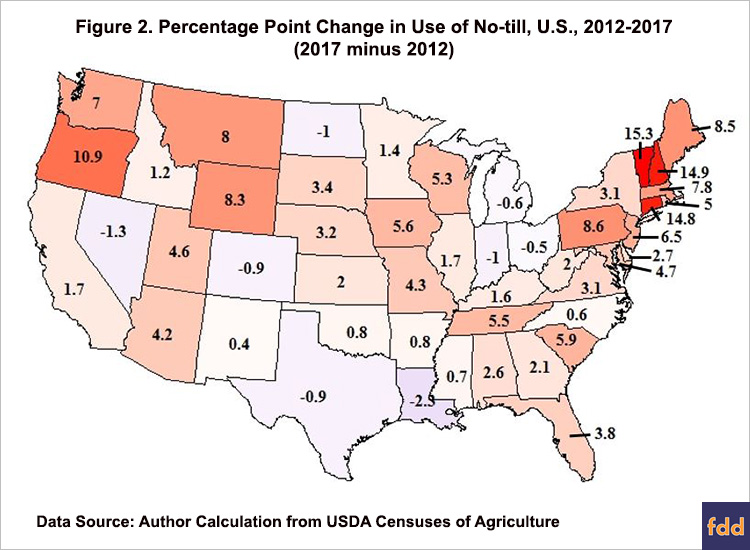
No till was used on 37% of US acres for which a tillage system was reported, up from 35% in the 2012 Census of Agriculture. Variation by state is substantial, ranging from 79% for Tennessee to 6% for Minnesota (see Figure 1). Variation for geographically contiguous states can also be large. For example, the 6% share in Minnesota contrasts with 35% in Iowa and North Dakota and 52% in South Dakota. Vermont had the largest increase in no-till between 2012 and 2107, +15.3 percentage points (pp) (see Figure 2). Louisiana had the largest decline, -2.3 pp.
Reduced Till
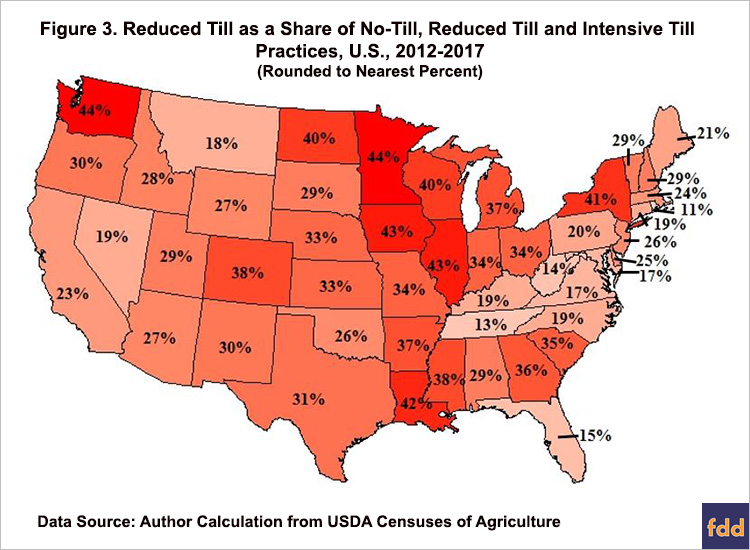
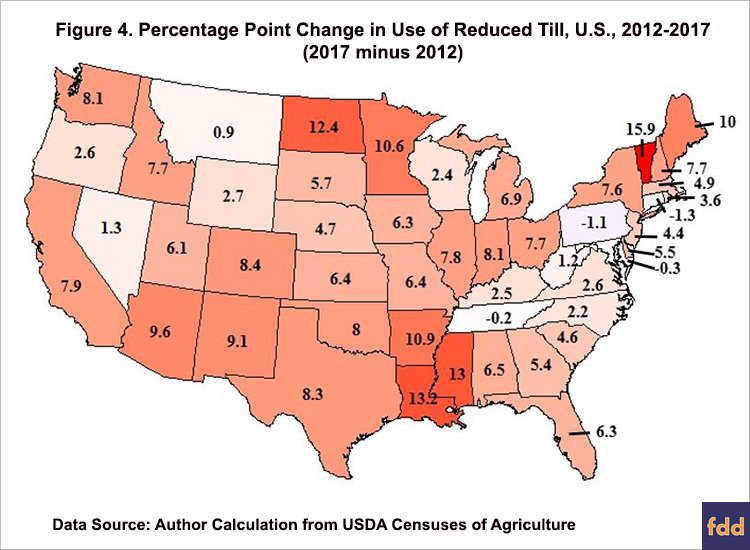
Reduced till, excluding no till, was used on 35% of US acres for which a tillage system was reported, up from 27% in 2012. Compared with no-till, reduced till’s share varied less by state, ranging from 44% for Washington and Minnesota to 11% for Rhode Island (see Figure 3). Reduced till’s share declined from 2012 for only 4 states, with the largest being -1.3 pp for Connecticut (see Figure 4). Alaska had the largest increase, +24.9 pp.
Intensive Till
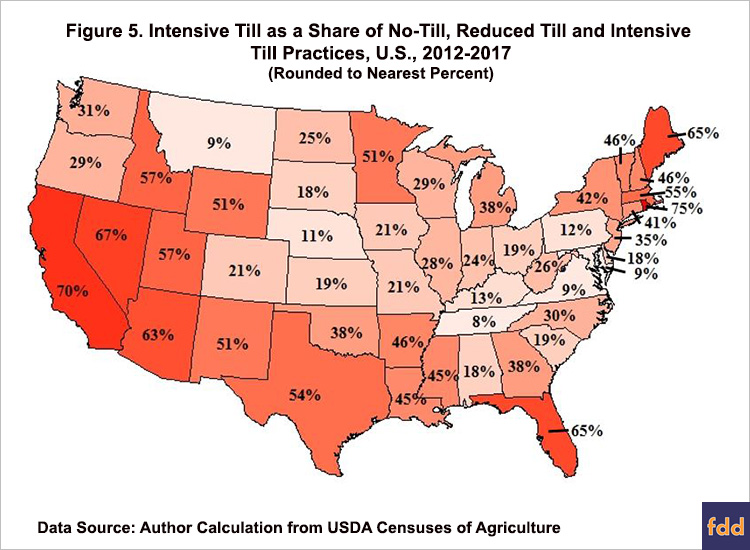
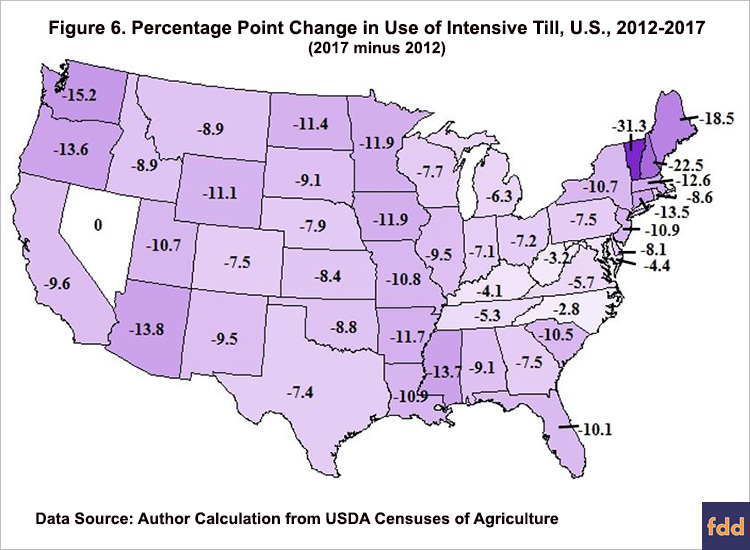
Intensive till was used on 28% of US acres for which a tillage system was reported, down from 38% in 2012. Like no-till, intensive till’s share varied substantially by state, ranging from 75% for Rhode Island to 8% for Tennessee (see Figure 5). Also similar to no-till, variation for contiguous states could be large. For example, Rhode Island’s 75% share in 2017 compares with shares of 55% for Massachusetts and 41% for Connecticut. Intensive till’s share was lower in 2017 than 2012 for 49 of the 50 states (see Figure 6). Nevada’s share did not change. Largest decline was -31.3 pp for Vermont.
Summary Observations
- As of the 2017 Census of Agriculture, US farmers’ choice of tillage system was fairly evenly split across no-till, reduced till excluding no-till, and intensive till.
- Biggest change from the 2012 Census of Agriculture was a shift from intensive to reduced till.
- Share of acres in no-till changed only slightly from 2012, prompting a question, “Is no-till’s share of acres plateauing?”
- Variation across the 50 states, even across contiguous states, in choice of tillage system is striking.
- This variation underscores the importance of understanding what factors influence a farmer’s choice of tillage system, including the role of field characteristic (soil type and slope for example), public policy (conservation compliance and subsidies for example), farmer preferences (profit vs. risk vs. environmental objective for example), as well as transition and learning costs.
References
US Department of Agriculture, National Agricultural Statistics Service. (April 2019). 2017 Census of Agriculture: United States Summary and State Data. Volume 1, Geographic Area Series, Part 51. AC-17-A-51 www.agcensus.usda.gov
Zulauf, C. and B. Brown. "Cover Crops, 2017 US Census of Agriculture." farmdoc daily (9):135, Department of Agricultural and Consumer Economics, University of Illinois at Urbana-Champaign, July 24, 2019.
Zulauf, C. and B. Brown. “Use of Tile, 2017 US Census of Agriculture.” farmdoc daily (9): 141. Department of Agricultural and Consumer Economics, University of Illinois at Urbana-Champaign. August 1, 2019.
Disclaimer: We request all readers, electronic media and others follow our citation guidelines when re-posting articles from farmdoc daily. Guidelines are available here. The farmdoc daily website falls under University of Illinois copyright and intellectual property rights. For a detailed statement, please see the University of Illinois Copyright Information and Policies here.


